النماذج الفعلية

النماذج هي نماذج رسومية تتشكل في الرسم البياني حسب السعر. وفقا لأحد المسلمات التحليلية الفنية، فإن التاريخ (حركة السعر) يكرر نفسه. ويعني ذلك أن حركات الأسعار غالباً ما تكون متشابهة في نفس الأوضاع مما يجعل من الممكن التنبؤ بزيادة تطوير الوضع الذي يتسم باحتمال كبير.
النماذج ذات الصلة المقدمة من قبل إنستافوركس هي خدمة سهلة الاستخدام تسمح لك بمعرفة التغييرات الأخيرة في السوق والرد على الأدلة من السوق في الوقت المناسب. في خدمتنا، ستجد دائمًا النماذج الأكثر حداثة وملاءمة في أي زوج وأي إطار زمني.
Actual Patterns
- All
- All
- Bearish Rectangle
- Bearish Symmetrical Triangle
- Bearish Symmetrical Triangle
- Bullish Rectangle
- Double Top
- Double Top
- Triple Bottom
- Triple Bottom
- Triple Top
- Triple Top
- All
- All
- Buy
- Sale
- All
- 1
- 2
- 3
- 4
- 5
Bearish Rectangle
was formed on 17.04 at 11:10:15 (UTC+0)
signal strength 1 of 5

According to the chart of M5, GOLD formed the Bearish Rectangle which is a pattern of a trend continuation. The pattern is contained within the following borders: lower border 3312.24
The M5 and M15 time frames may have more false entry points.
Open chart in a new window
Double Bottom
was formed on 17.04 at 11:00:16 (UTC+0)
signal strength 3 of 5

The Double Bottom pattern has been formed on NZDCAD M30. Characteristics: the support level 0.8188; the resistance level 0.8232; the width of the pattern 44 points. If the resistance level
Open chart in a new window
Bullish Flag
was formed on 17.04 at 09:47:17 (UTC+0)
signal strength 1 of 5

The Bullish Flag pattern has been formed on NZDCHF at M5. The lower boundary of the pattern is located at 0.4839/0.4829, while the higher boundary lies at 0.4849/0.4839. The projection
The M5 and M15 time frames may have more false entry points.
Open chart in a new window
Bullish pennant
was formed on 17.04 at 09:47:11 (UTC+0)
signal strength 1 of 5

The Bullish pennant signal – Trading instrument NZDCHF M5, continuation pattern. Forecast: it is possible to set up a buy position above the pattern’s high of 0.4849, with the prospect
The M5 and M15 time frames may have more false entry points.
Open chart in a new window
Bullish pennant
was formed on 17.04 at 09:45:13 (UTC+0)
signal strength 1 of 5
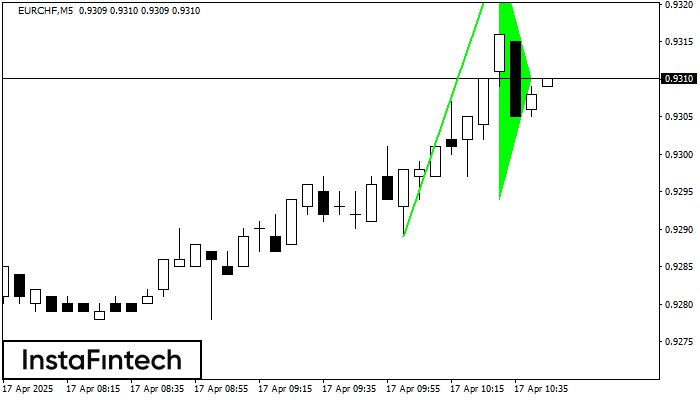
The Bullish pennant pattern is formed on the EURCHF M5 chart. It is a type of the continuation pattern. Supposedly, in case the price is fixed above the pennant’s high
The M5 and M15 time frames may have more false entry points.
Open chart in a new window
Double Bottom
was formed on 17.04 at 09:29:51 (UTC+0)
signal strength 1 of 5
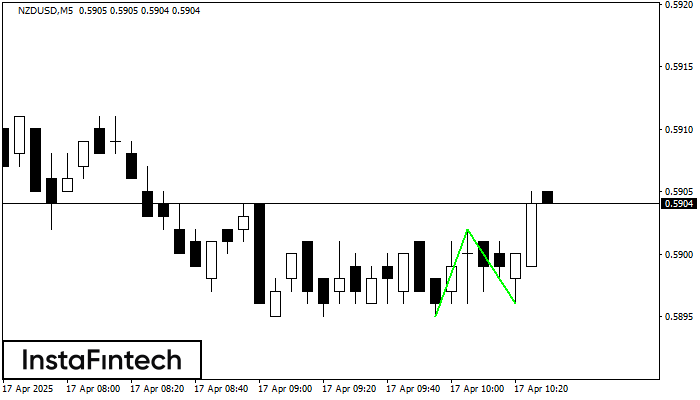
The Double Bottom pattern has been formed on NZDUSD M5; the upper boundary is 0.5902; the lower boundary is 0.5896. The width of the pattern is 7 points. In case
The M5 and M15 time frames may have more false entry points.
Open chart in a new window
Bullish Symmetrical Triangle
was formed on 17.04 at 09:11:38 (UTC+0)
signal strength 1 of 5
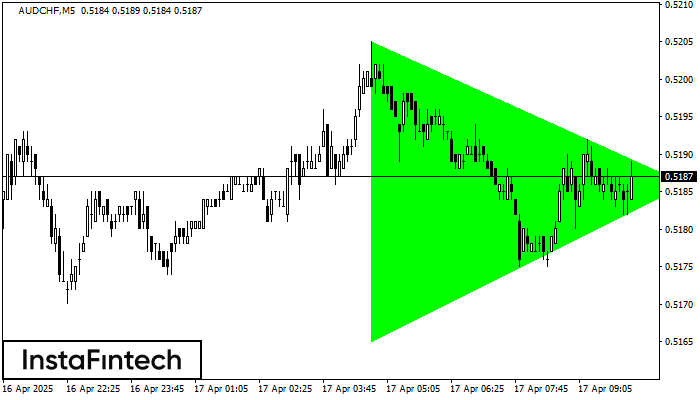
According to the chart of M5, AUDCHF formed the Bullish Symmetrical Triangle pattern. The lower border of the pattern touches the coordinates 0.5165/0.5186 whereas the upper border goes across 0.5205/0.5186
The M5 and M15 time frames may have more false entry points.
Open chart in a new window
Bullish pennant
was formed on 17.04 at 09:00:37 (UTC+0)
signal strength 1 of 5
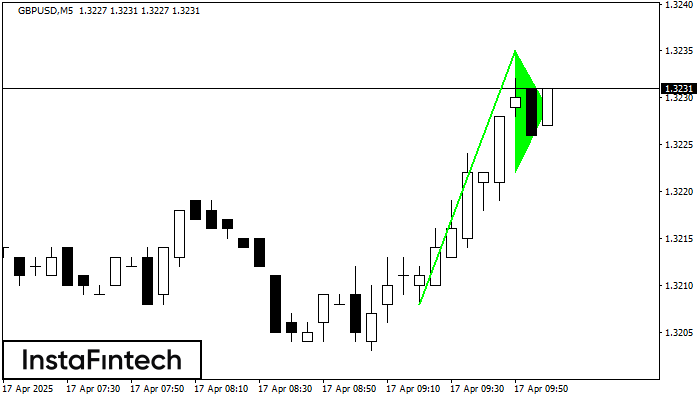
The Bullish pennant graphic pattern has formed on the GBPUSD M5 instrument. This pattern type falls under the category of continuation patterns. In this case, if the quote can breaks
The M5 and M15 time frames may have more false entry points.
Open chart in a new window
Double Bottom
was formed on 17.04 at 09:00:17 (UTC+0)
signal strength 3 of 5
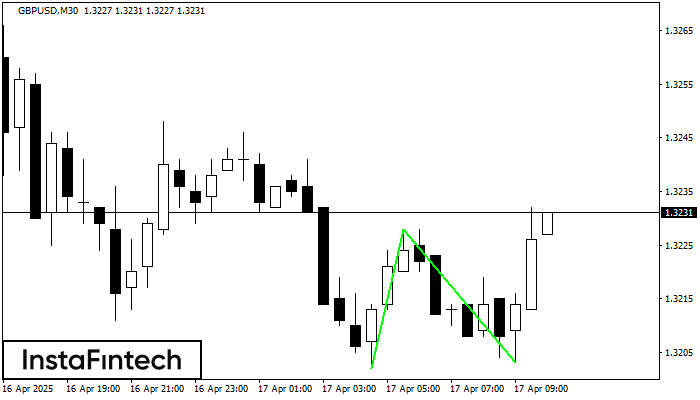
The Double Bottom pattern has been formed on GBPUSD M30; the upper boundary is 1.3228; the lower boundary is 1.3203. The width of the pattern is 26 points. In case
Open chart in a new window