আরও দেখুন

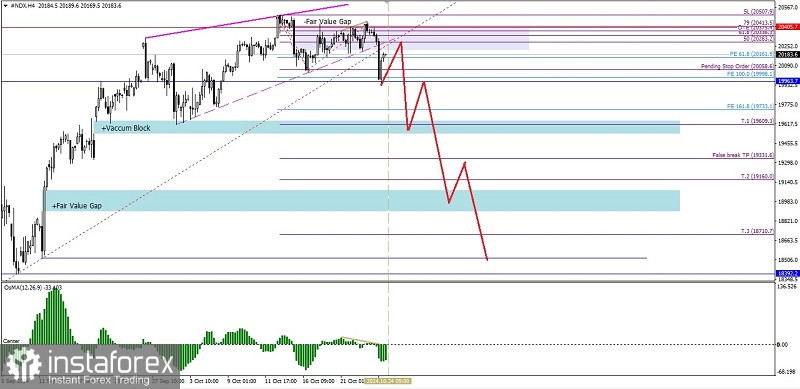
After successfully breaking out below the Rising Wedge pattern on its 4-hour chart, the Nasdaq 100 Index now appears to be retracing upwards to test its Bearish Fair Value Gap area level where 20336.3 will most likely be tested in the near future, but as long as it does not break through and close above the 20479.0 level, this currency pair will weaken again down to the 19963.7 level and if volatility and momentum support it, it is not impossible that #NDX will head to the 19237.8 level which is confirmed by the appearance of a deviation between the price movement of the index which has a deviation with the MACD Histogram (osMA) indicator.
(Disclaimer)
You have already liked this post today
*এখানে পোস্ট করা মার্কেট বিশ্লেষণ আপনার সচেতনতা বৃদ্ধির জন্য প্রদান করা হয়, ট্রেড করার নির্দেশনা প্রদানের জন্য প্রদান করা হয় না।


