USDCAD (US Dollar vs Canadian Dollar). Exchange rate and online charts.
See Also
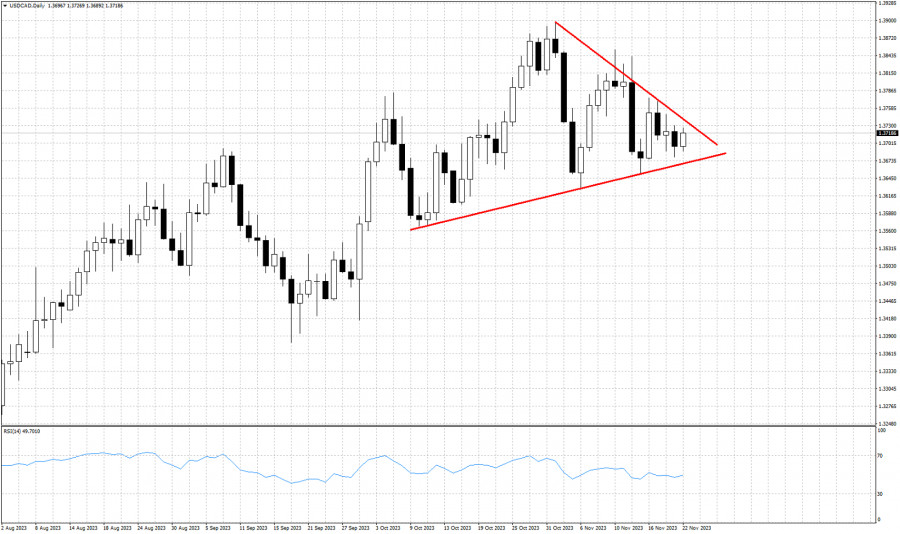
- USDCAD is trading around 1.3730, Price has made little progress over the last 40 days. Price is at the same price level since the beginning of October. USDCAD has formed a triangle pattern with lower highs and higher lows. This consolidation is expected to end soon as there is very little space.
Author: Alexandros Yfantis
15:58 2023-11-22 UTC+2
15823
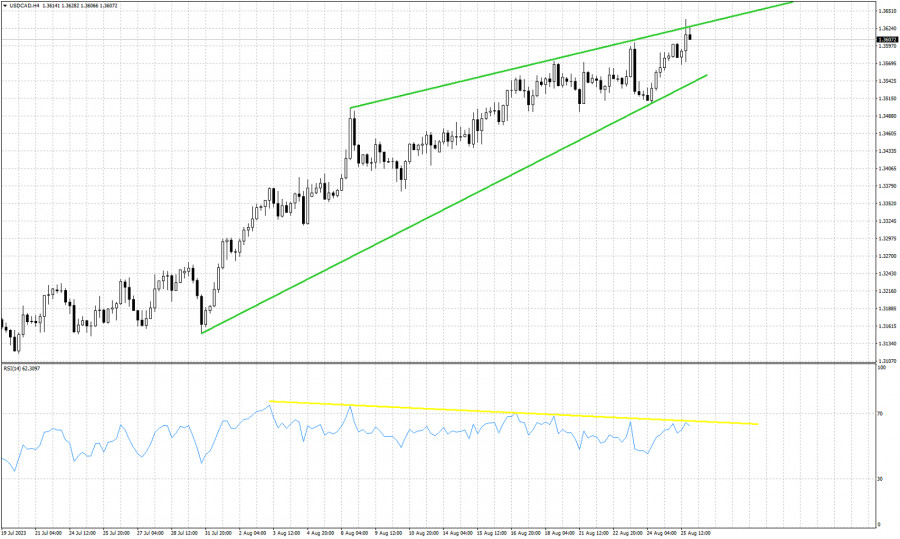
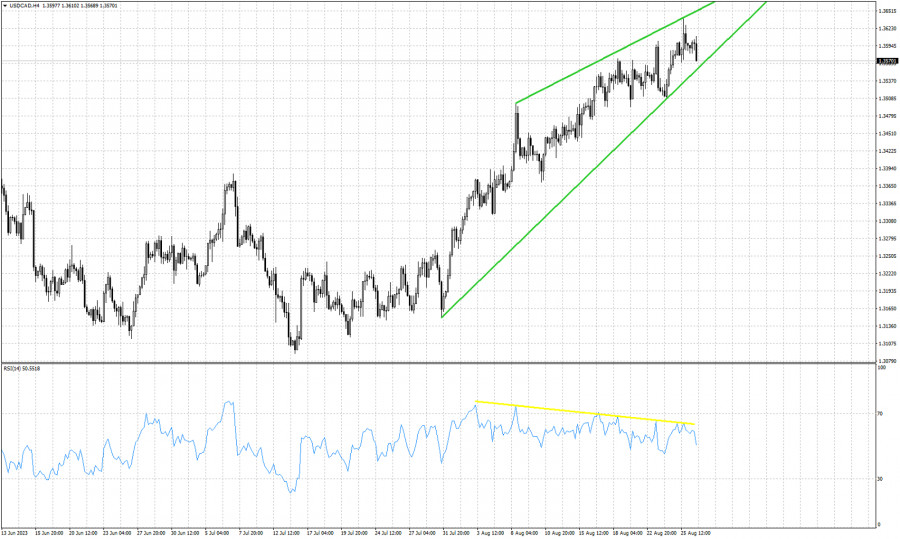
USDCAD is trading around 1.3605 after making a new higher high today at 1.3638. The new higher high in price was not followed by a higher high in the RSI. On the contrary the RSI made a new lower high forming another bearish divergence.Author: Alexandros Yfantis
20:33 2023-08-25 UTC+2
9568
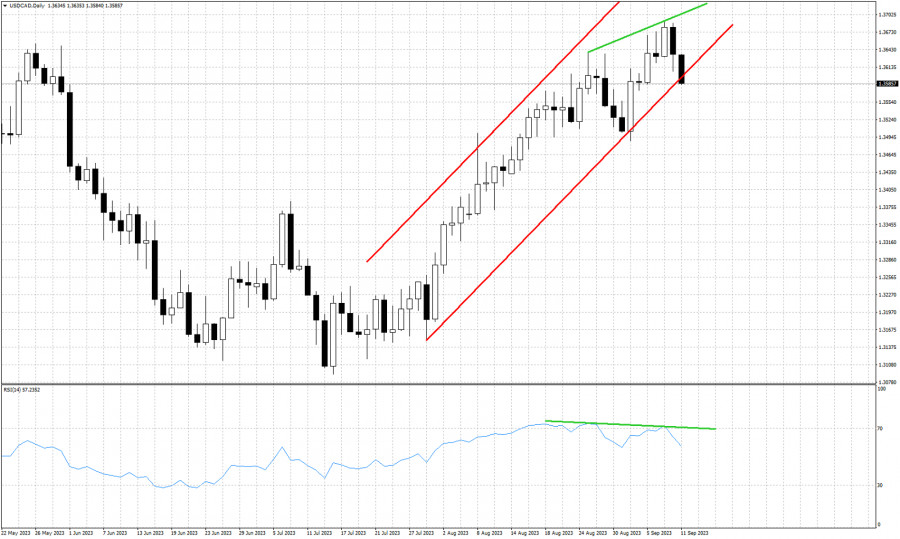
USDCAD remains technically in a bullish trend making higher highs and higher lows. Price remains inside the bullish channel but today price is under pressure. Despite the new higher high yesterday, the RSI did not follow and made a lower high.Author: Alexandros Yfantis
17:28 2023-09-08 UTC+2
8968
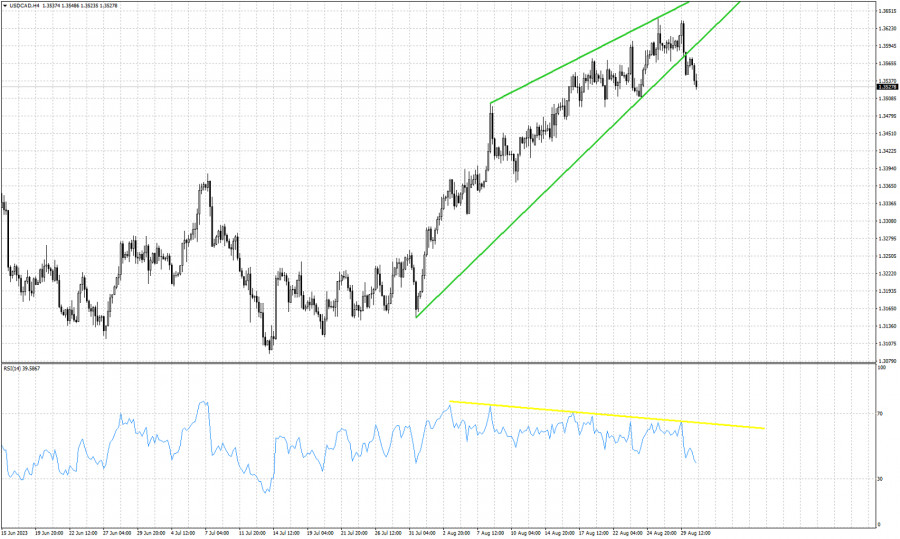
- In previous posts we talked about the limited upside potential in USDCAD and that we preferred to be neutral if not bearish. We were expecting a down turn despite price making higher highs and higher lows.
Author: Alexandros Yfantis
17:14 2023-08-30 UTC+2
7258
USDCAD continues to remain under pressure. When price was trading around 1.36-1.3680 we warned traders that a pull back was imminent and we preferred to be neutral if not bearish. USDCAD had provided a bearish signal once it broke below the bullish channel at 1.36-1.3620.Author: Alexandros Yfantis
16:37 2023-09-19 UTC+2
6808
USDCAD is trading around 1.3574 after making a new higher high last week around 1.3638. As we mentioned in our previous posts, we continue to believe that the upside potential is limited. Price technically remains in a bullish trend, but the RSI is not making higher highs. Instead the RSI is.Author: Alexandros Yfantis
16:51 2023-08-28 UTC+2
6763
- In our analysis on USDCAD last week we noted three things. First was the bearish RSI divergence. Despite the higher highs in price, the RSI did not follow suggesting that a pull back was imminent. Secondly we noted that a pull back at least towards the lower channel boundary was justified and.
Author: Alexandros Yfantis
14:00 2023-09-11 UTC+2
6448
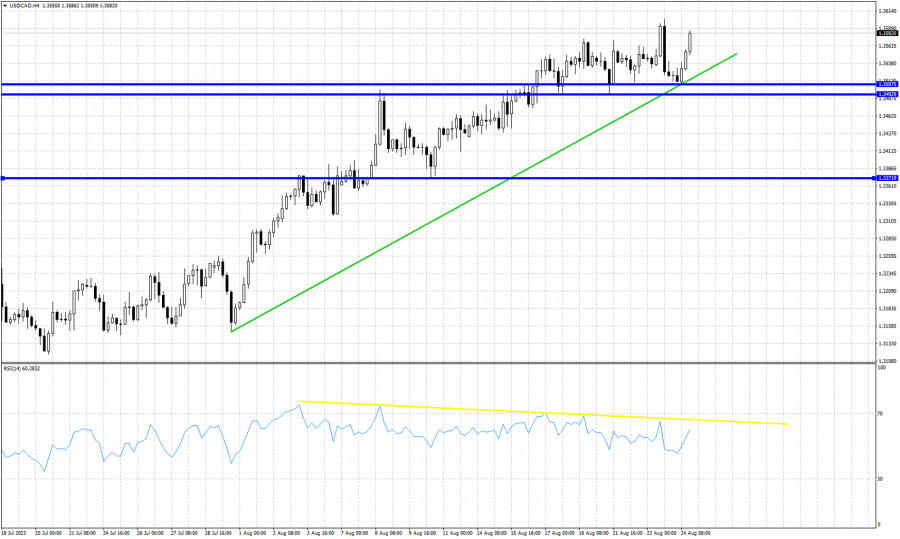
USDCAD is trading around 1.3573 still making higher highs and higher lows. Recent pull back towards 1.3508 almost gave us a bearish reversal signal, but price did not form a lower low. Instead price formed a new higher low and is now bouncing higher with potential to reach 1.36.Author: Alexandros Yfantis
15:57 2023-08-24 UTC+2
5818
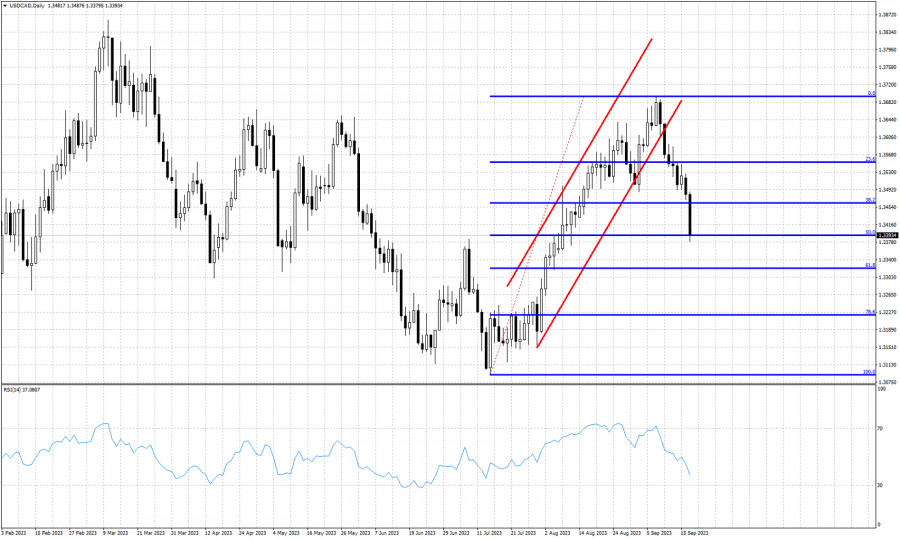
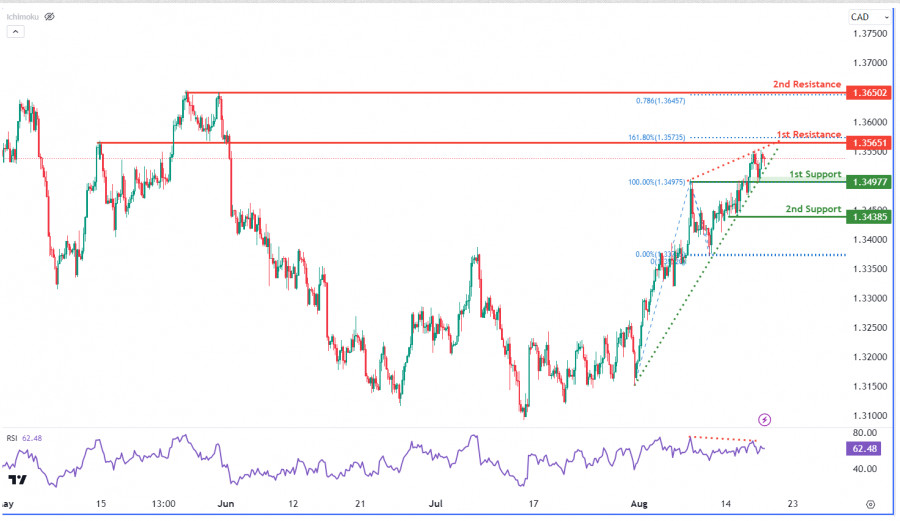
The USD/CAD chart displays a bearish trend, reinforced by an RSI indicator showing bearish divergence with the price. The price might descend towards the 1st support at 1.3498 and the 2nd support at 1.3387, both being overlap supports. Conversely, the 1st resistance at 1.3565 aligns with the.Author: Dean Leo
05:59 2023-08-18 UTC+2
5653

- USDCAD is trading around 1.3730, Price has made little progress over the last 40 days. Price is at the same price level since the beginning of October. USDCAD has formed a triangle pattern with lower highs and higher lows. This consolidation is expected to end soon as there is very little space.
Author: Alexandros Yfantis
15:58 2023-11-22 UTC+2
15823
- USDCAD is trading around 1.3605 after making a new higher high today at 1.3638. The new higher high in price was not followed by a higher high in the RSI. On the contrary the RSI made a new lower high forming another bearish divergence.
Author: Alexandros Yfantis
20:33 2023-08-25 UTC+2
9568
- USDCAD remains technically in a bullish trend making higher highs and higher lows. Price remains inside the bullish channel but today price is under pressure. Despite the new higher high yesterday, the RSI did not follow and made a lower high.
Author: Alexandros Yfantis
17:28 2023-09-08 UTC+2
8968
- In previous posts we talked about the limited upside potential in USDCAD and that we preferred to be neutral if not bearish. We were expecting a down turn despite price making higher highs and higher lows.
Author: Alexandros Yfantis
17:14 2023-08-30 UTC+2
7258
- USDCAD continues to remain under pressure. When price was trading around 1.36-1.3680 we warned traders that a pull back was imminent and we preferred to be neutral if not bearish. USDCAD had provided a bearish signal once it broke below the bullish channel at 1.36-1.3620.
Author: Alexandros Yfantis
16:37 2023-09-19 UTC+2
6808
- USDCAD is trading around 1.3574 after making a new higher high last week around 1.3638. As we mentioned in our previous posts, we continue to believe that the upside potential is limited. Price technically remains in a bullish trend, but the RSI is not making higher highs. Instead the RSI is.
Author: Alexandros Yfantis
16:51 2023-08-28 UTC+2
6763
- In our analysis on USDCAD last week we noted three things. First was the bearish RSI divergence. Despite the higher highs in price, the RSI did not follow suggesting that a pull back was imminent. Secondly we noted that a pull back at least towards the lower channel boundary was justified and.
Author: Alexandros Yfantis
14:00 2023-09-11 UTC+2
6448
- USDCAD is trading around 1.3573 still making higher highs and higher lows. Recent pull back towards 1.3508 almost gave us a bearish reversal signal, but price did not form a lower low. Instead price formed a new higher low and is now bouncing higher with potential to reach 1.36.
Author: Alexandros Yfantis
15:57 2023-08-24 UTC+2
5818
- The USD/CAD chart displays a bearish trend, reinforced by an RSI indicator showing bearish divergence with the price. The price might descend towards the 1st support at 1.3498 and the 2nd support at 1.3387, both being overlap supports. Conversely, the 1st resistance at 1.3565 aligns with the.
Author: Dean Leo
05:59 2023-08-18 UTC+2
5653