Actual patterns

Patterns are graphical models which are formed in the chart by the price. According to one of the technical analysis postulates, history (price movement) repeats itself. It means that the price movements are often similar in the same situations which makes it possible to predict the further development of the situation with a high probability.
Relevant patterns by InstaTrade is an easy-to-use service which allows you to be aware of latest changes in the market and react to clues from the market in time. In our service you will always find the latest and most relevant patterns on any pair and any timeframe.
Actual Patterns
- All
- All
- Bearish Rectangle
- Bearish Symmetrical Triangle
- Bearish Symmetrical Triangle
- Bullish Rectangle
- Double Top
- Double Top
- Triple Bottom
- Triple Bottom
- Triple Top
- Triple Top
- All
- All
- Buy
- Sale
- All
- 1
- 2
- 3
- 4
- 5
Double Top
was formed on 01.04 at 02:15:45 (UTC+0)
signal strength 2 of 5
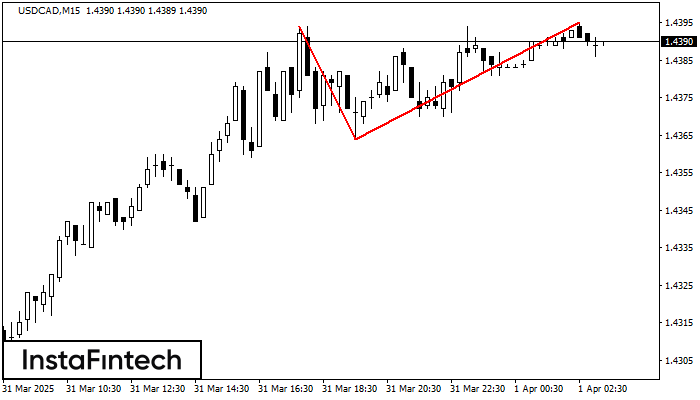
The Double Top reversal pattern has been formed on USDCAD M15. Characteristics: the upper boundary 1.4394; the lower boundary 1.4364; the width of the pattern is 31 points. Sell trades
The M5 and M15 time frames may have more false entry points.
Open chart in a new window
Triple Top
was formed on 01.04 at 02:00:23 (UTC+0)
signal strength 2 of 5

The Triple Top pattern has formed on the chart of the GOLD M15 trading instrument. It is a reversal pattern featuring the following characteristics: resistance level 76, support level -995
The M5 and M15 time frames may have more false entry points.
Open chart in a new window
Double Bottom
was formed on 01.04 at 01:05:27 (UTC+0)
signal strength 1 of 5
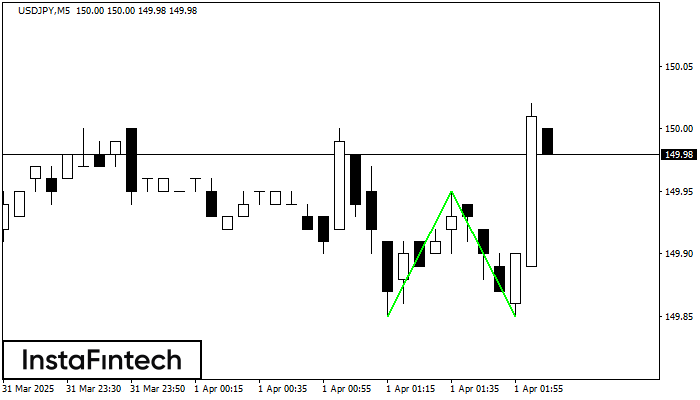
The Double Bottom pattern has been formed on USDJPY M5; the upper boundary is 149.95; the lower boundary is 149.85. The width of the pattern is 10 points. In case
The M5 and M15 time frames may have more false entry points.
Open chart in a new window
Triple Top
was formed on 01.04 at 00:15:38 (UTC+0)
signal strength 1 of 5
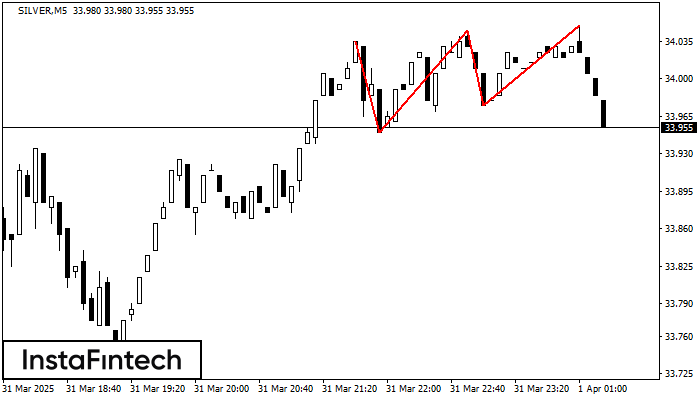
On the chart of the SILVER M5 trading instrument, the Triple Top pattern that signals a trend change has formed. It is possible that after formation of the third peak
The M5 and M15 time frames may have more false entry points.
Open chart in a new window
Double Top
was formed on 01.04 at 00:06:09 (UTC+0)
signal strength 1 of 5
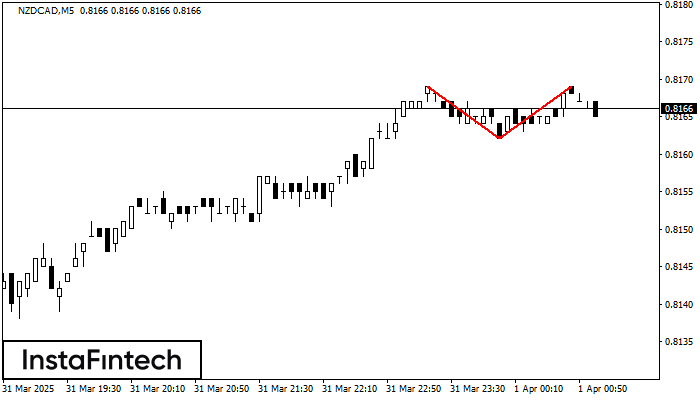
The Double Top pattern has been formed on NZDCAD M5. It signals that the trend has been changed from upwards to downwards. Probably, if the base of the pattern 0.8162
The M5 and M15 time frames may have more false entry points.
Open chart in a new window
Triple Bottom
was formed on 31.03 at 23:06:34 (UTC+0)
signal strength 1 of 5
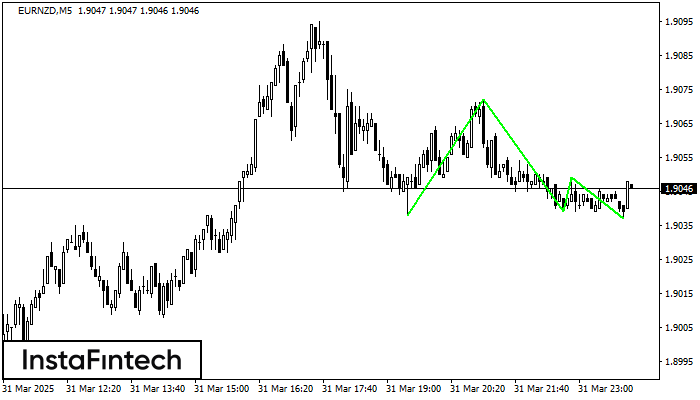
The Triple Bottom pattern has been formed on EURNZD M5. It has the following characteristics: resistance level 1.9072/1.9049; support level 1.9038/1.9037; the width is 34 points. In the event
The M5 and M15 time frames may have more false entry points.
Open chart in a new window
Double Top
was formed on 31.03 at 22:45:21 (UTC+0)
signal strength 2 of 5
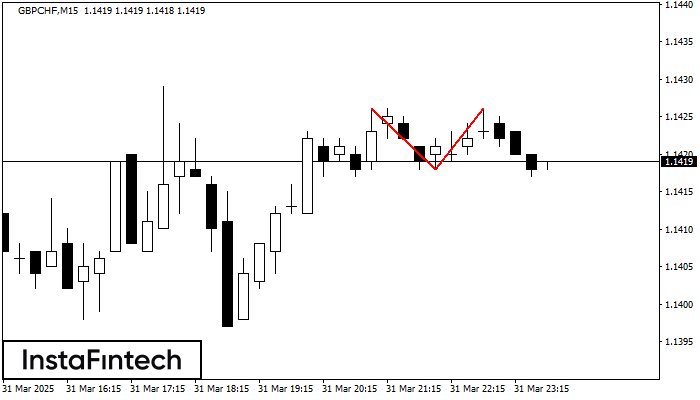
The Double Top reversal pattern has been formed on GBPCHF M15. Characteristics: the upper boundary 1.1426; the lower boundary 1.1418; the width of the pattern is 8 points. Sell trades
The M5 and M15 time frames may have more false entry points.
Open chart in a new window
Double Top
was formed on 31.03 at 22:05:12 (UTC+0)
signal strength 1 of 5
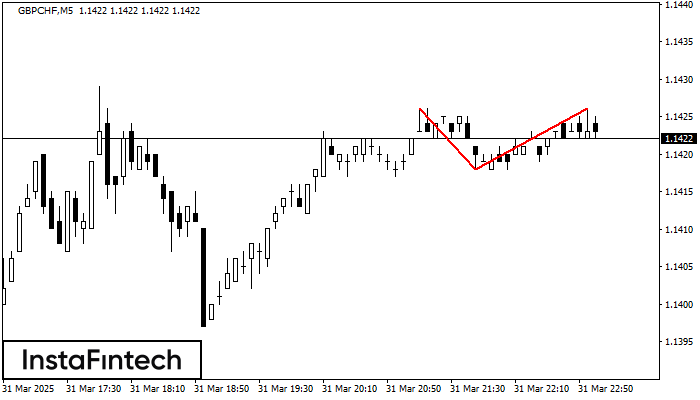
The Double Top pattern has been formed on GBPCHF M5. It signals that the trend has been changed from upwards to downwards. Probably, if the base of the pattern 1.1418
The M5 and M15 time frames may have more false entry points.
Open chart in a new window
Double Bottom
was formed on 31.03 at 21:55:26 (UTC+0)
signal strength 1 of 5
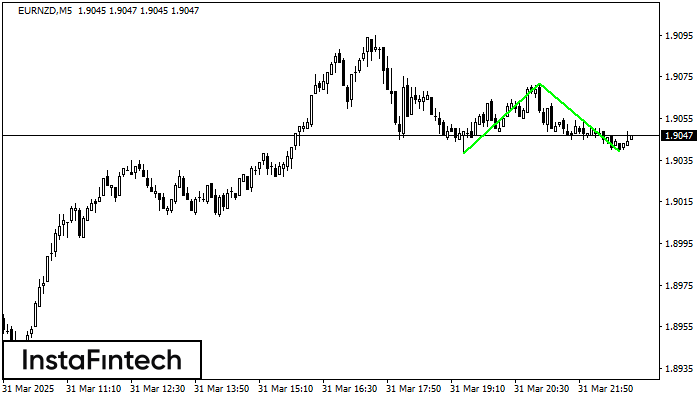
The Double Bottom pattern has been formed on EURNZD M5; the upper boundary is 1.9072; the lower boundary is 1.9039. The width of the pattern is 34 points. In case
The M5 and M15 time frames may have more false entry points.
Open chart in a new window