See also


 09.12.2021 08:40 AM
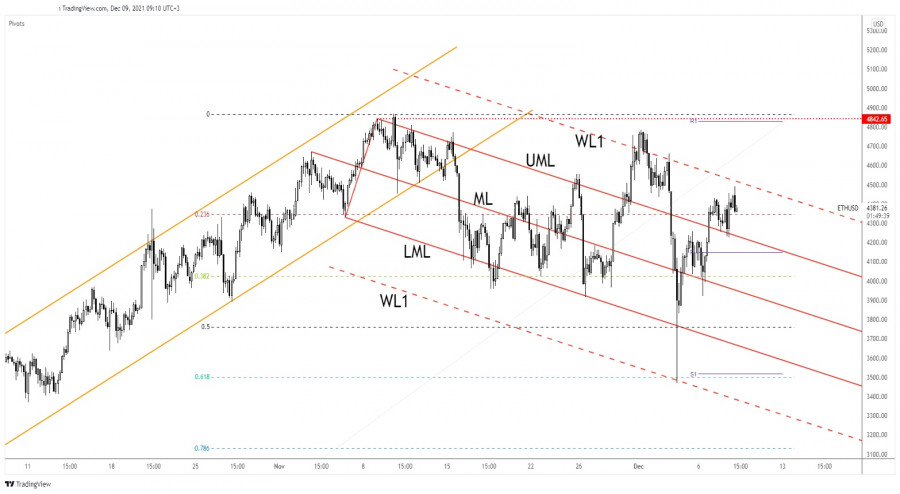
Ethereum was trading at 4,392.14 level at the moment of writing, below today's high of 4,491.99. ETH/USD registered a 29.45% growth from 3,470.02 Saturday's low to 4,491.99 today's high. The crypto erased some of its losses signaling that the downside is limited and that the price could come back towards the 4,842.65 all-time high.
In the short term, a temporary correction was expected. The price action signaled that the downwards movement is over, so we could search for new long opportunities. In the last 24 hours, ETH/USD is up by 0.39% but it's still down by 3.29% in the last 7 days.
As you can see on the H4 chart, Ethereum registered a false breakdown with great separation below the 50% and 61.8% retracement levels, under the lower median line (LML), and through the warning line (WL1). Also, its failure to stabilize under the 3,958.67 signaled that the downside movement ended.
It has retested the 3,958.67 registering a new false breakdown with great separation belwo this obstacle and now is traded above teh 23.6% retarcement level. The warning line (WL1) of the descending pitchfork's stands as a dynamic resistance.
Stabilizing above the 23.6% (4,345.45) retracement level and making a valid breakout through the warning line (WL1) could announce potential upside continuation at least towards the 4,842.65 historical high.
In the short term, the pressure remains high, we cannot exclude a temporary decline. ETH/USD could come back to test and retest the upper median line (UML) trying to accumulate more bullish energy before jumping higher.
You have already liked this post today
*The market analysis posted here is meant to increase your awareness, but not to give instructions to make a trade.
Bitcoin and Ethereum dropped in value toward the end of Thursday's U.S. session but recovered during today's Asian trading hours. It has become common practice that the crypto market declined
With the appearance of divergence between the price movement of the Polkadot cryptocurrency and the Stochastic Oscillator indicator on its 4-hour chart, as long as there is no weakening correction
From what is seen on the 4-hour chart of the Uniswap cryptocurrency, there appears to be a divergence between the Uniswap price movement and the Stochastic Oscillator indicator, so based
Bitcoin and Ethereum collapsed by the end of Tuesday, continuing the heavy sell-off during today's Asian session. Another sharp decline in the U.S. stock market dragged other risk assets down
Graphical patterns
indicator.
Notices things
you never will!

Your IP address shows that you are currently located in the USA. If you are a resident of the United States, you are prohibited from using the services of InstaFintech Group including online trading, online transfers, deposit/withdrawal of funds, etc.
If you think you are seeing this message by mistake and your location is not the US, kindly proceed to the website. Otherwise, you must leave the website in order to comply with government restrictions.
Why does your IP address show your location as the USA?
Please confirm whether you are a US resident or not by clicking the relevant button below. If you choose the wrong option, being a US resident, you will not be able to open an account with InstaTrade anyway.
We are sorry for any inconvenience caused by this message.

