See also


 23.08.2024 10:21 AM
Data on business activity indexes in the Eurozone, the UK, and the United States were published on Thursday. Nearly all indexes showed growth, but market attention was drawn to other events. The focus shifted to the news flow related to the beginning of the annual economic symposium in Jackson Hole, which traditionally influences monetary policy direction for the coming year. This year's central theme is "Reassessing the Effectiveness and Transmission of Monetary Policy."
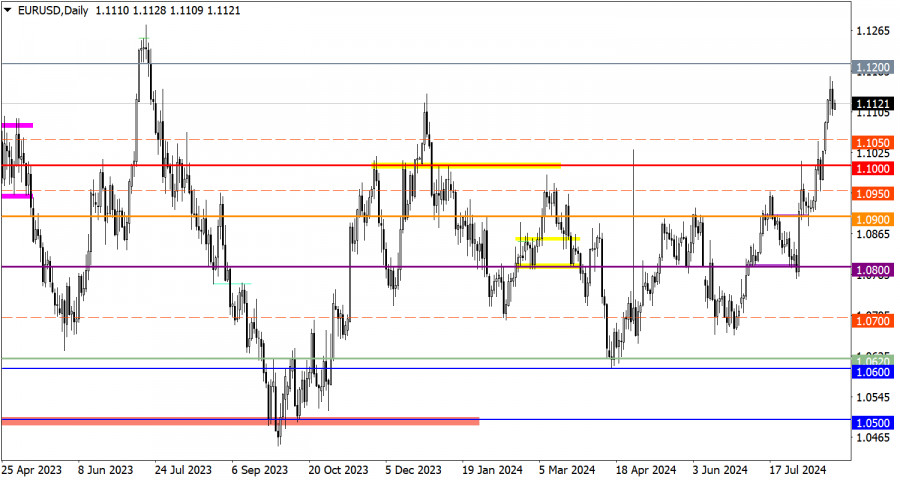
The EUR/USD pair experienced a slight pullback after breaking the local peak from December 2023. However, this movement does not disrupt the general upward trend.
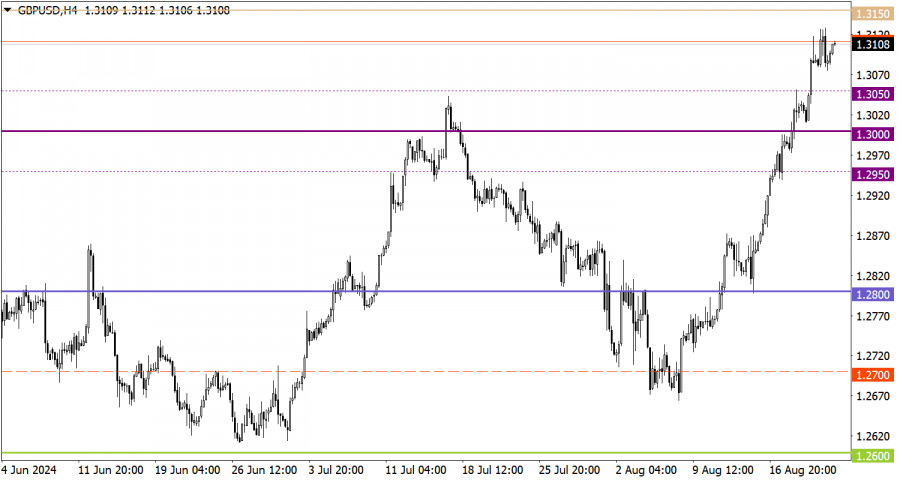
The GBP/USD pair also underwent a correction, but the extent was so minor that the price has almost fully recovered the volume of long positions.
The economic calendar for August 23 includes data on the US construction sector. However, the market's primary focus will be the Federal Reserve head's speech at the annual Jackson Hole symposium. Fed Chair Jerome Powell is expected to provide specific guidance regarding the central bank's upcoming actions, making this information critically important for traders.
In the context of the current regrouping of trading forces after the correction, there are prospects for an increase in the volume of long positions in the euro. The quotes might aim for the peak of the current uptrend around 1.1280. In an alternative scenario, if the pullback continues, a return to the level of 1.1000 is possible.
The British pound's uptrend will strengthen if the quote remains above 1.3150, which could lead to further appreciation. However, if this condition is not met, the risk of a correction to the 1.3000 level remains.
Candlestick Chart: This chart type displays graphic rectangles in white and black with lines at the top and bottom. A detailed analysis of each candlestick reveals its characteristics relative to a specific period: opening price, closing price, highest price, and lowest price.
Horizontal Levels: These are price coordinates where the price might experience a halt or reversal. In the market, these levels are referred to as support and resistance.
Circles and Rectangles: These are highlighted examples where the price reversed in the past. The color highlighting indicates horizontal lines that may exert pressure on the quote in the future.
Up/Down Arrows: These are indicators of the potential future direction of the price.
You have already liked this post today
*The market analysis posted here is meant to increase your awareness, but not to give instructions to make a trade.
Analysis of Thursday's Trades 1H Chart of EUR/USD On Thursday, the EUR/USD currency pair resumed its upward movement and posted a gain of more than 300 pips. As Friday began
The EUR/USD currency pair showed ultra-strong growth on Thursday—a move that, by now, probably surprised no one. Just as we reported that tariffs on China had been raised to 125%
Analysis of Wednesday's Trades 1H Chart of GBP/USD The GBP/USD pair spent the past 24 hours rising, then falling again, and then rising again. As before, it's impossible to identify
Analysis of Wednesday's Trades 1H Chart of EUR/USD The EUR/USD currency pair showed strong growth and decline on Wednesday. Lately, both moves have been triggered by Donald Trump. First, news
On Wednesday, the GBP/USD currency pair showed mixed movements throughout the day but generally maintained a downward trend — if we can even call the current behavior a "trend." There
On Wednesday, the EUR/USD currency pair moved exactly as expected — in several aspects. First, let's start with the "triangle" pattern we discussed yesterday. We warned that such formations often

Your IP address shows that you are currently located in the USA. If you are a resident of the United States, you are prohibited from using the services of InstaFintech Group including online trading, online transfers, deposit/withdrawal of funds, etc.
If you think you are seeing this message by mistake and your location is not the US, kindly proceed to the website. Otherwise, you must leave the website in order to comply with government restrictions.
Why does your IP address show your location as the USA?
Please confirm whether you are a US resident or not by clicking the relevant button below. If you choose the wrong option, being a US resident, you will not be able to open an account with InstaTrade anyway.
We are sorry for any inconvenience caused by this message.


