See also

 24.10.2024 04:06 PM
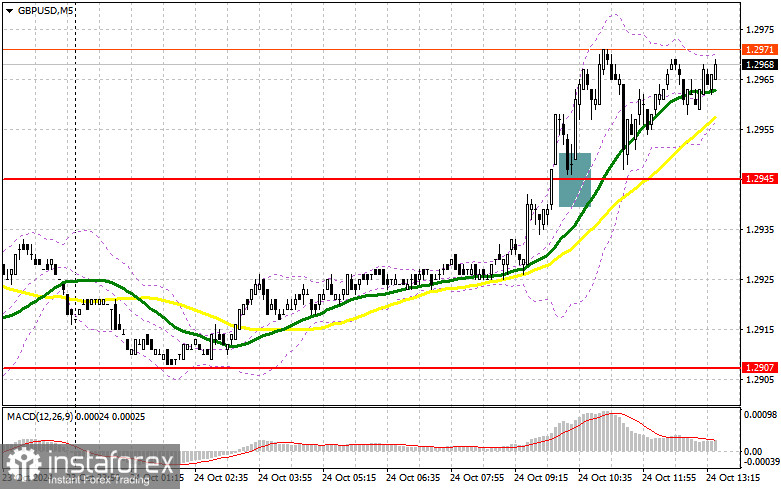
To open long positions on GBP/USD:
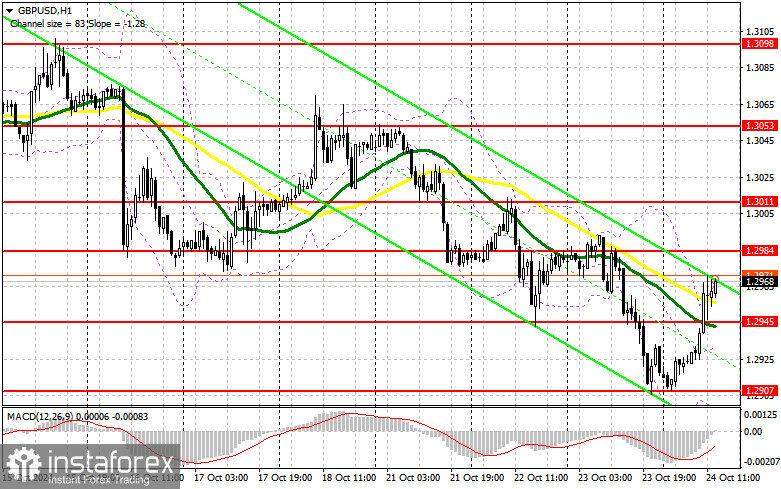
Despite the lackluster UK activity data, the figures are still better than those in other countries, and the British pound responded with growth and a fairly decent recovery. If the figures for U.S. initial jobless claims and the manufacturing and services PMI indices turn out better than economists' forecasts, the pound may decline, which I plan to take advantage of. Another formation of a false breakout around the 1.2945 support, from which we have already bought once today, will confirm a suitable entry point for long positions aiming for an update to 1.2984. Weak U.S. data and a breakout with a retest of 1.2984, similar to what I discussed earlier, will lead to a new entry point for long positions with the potential to test 1.3011. The ultimate target will be the level of 1.3053, where I plan to take profit. If GBP/USD declines and bulls show no activity around 1.2945 in the second half of the day, the bearish market will likely return. This will also lead to a drop and an update of the next support at 1.2907. A false breakout there will be a suitable condition for opening long positions. I plan to buy GBP/USD immediately if the pair rebounds from the 1.2884 low, aiming for a correction of 30-35 points within the day.
To open short positions on GBP/USD:
Sellers have pulled back, and it is crucial to monitor the nearest resistance at 1.2984, which could be influenced by U.S. statistics. A false breakout there will provide a suitable opportunity for a sell with a target of dropping to the 1.2945 support. A breakout and retest from below of this range will pressure buyers, triggering stop orders and opening the way toward 1.2907. The ultimate target will be the 1.2884 level, where I will take profit. Testing this level will strengthen the bearish market. If GBP/USD rises and there is no activity at 1.2984 in the second half of the day, buyers will attempt to regain initiative. Bears will then have no choice but to retreat to the resistance area of 1.3011. I will only sell there on a false breakout. If there is no downward movement there, I will look for short positions on a rebound around 1.3053, but only with an expectation of a 30-35 point downward correction.
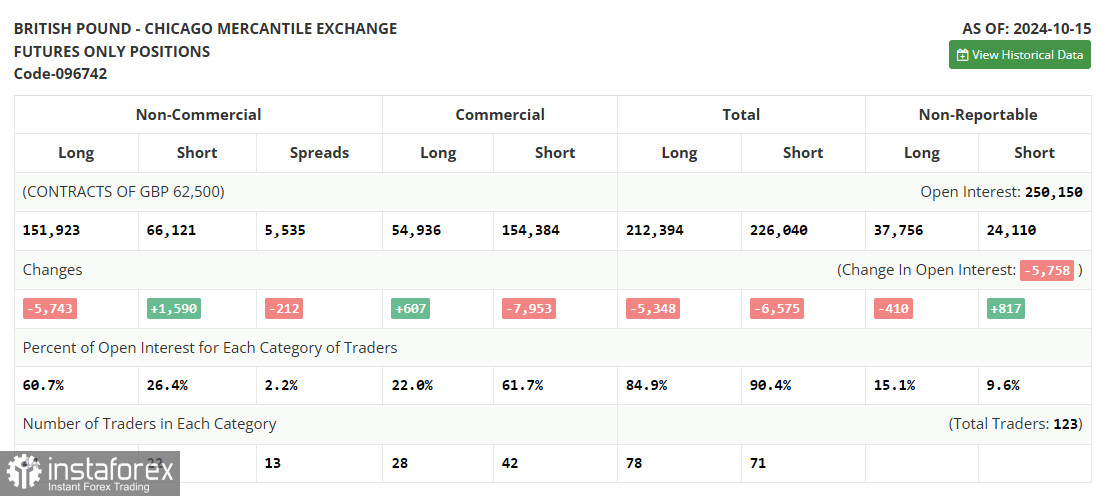
In the COT report (Commitment of Traders) for October 15, long positions decreased while short positions increased. However, this did not notably affect the balance between buyers and sellers, as the number of buyers remained nearly two and a half times higher. UK labor market and inflation data weighed on the pound's upward potential, as all indicators suggest a further decrease in interest rates in the UK, which is unfavorable for the national currency. This week, there is no significant economic data. As a result, all attention will be on statements from Bank of England representatives, which may provide insights into the regulator's future policy. The latest COT report indicated that long non-commercial positions decreased by 5,743 to a total of 151,923, while short non-commercial positions increased by 1,590 to a total of 66,121. As a result, the gap between long and short positions narrowed by 212.
Indicator Signals:
Moving Averages:
Trading is taking place around the 30- and 50-day moving averages, indicating an upward correction in the pair.
Note: The period and prices of moving averages are considered by the author on the hourly H1 chart and differ from the general definition of classic daily moving averages on the daily D1 chart.
Bollinger Bands:
If the pair declines, the lower boundary of the indicator around 1.2895 will act as support.
Indicator Descriptions:
You have already liked this post today
*The market analysis posted here is meant to increase your awareness, but not to give instructions to make a trade.


