See also

 25.10.2024 03:36 AM
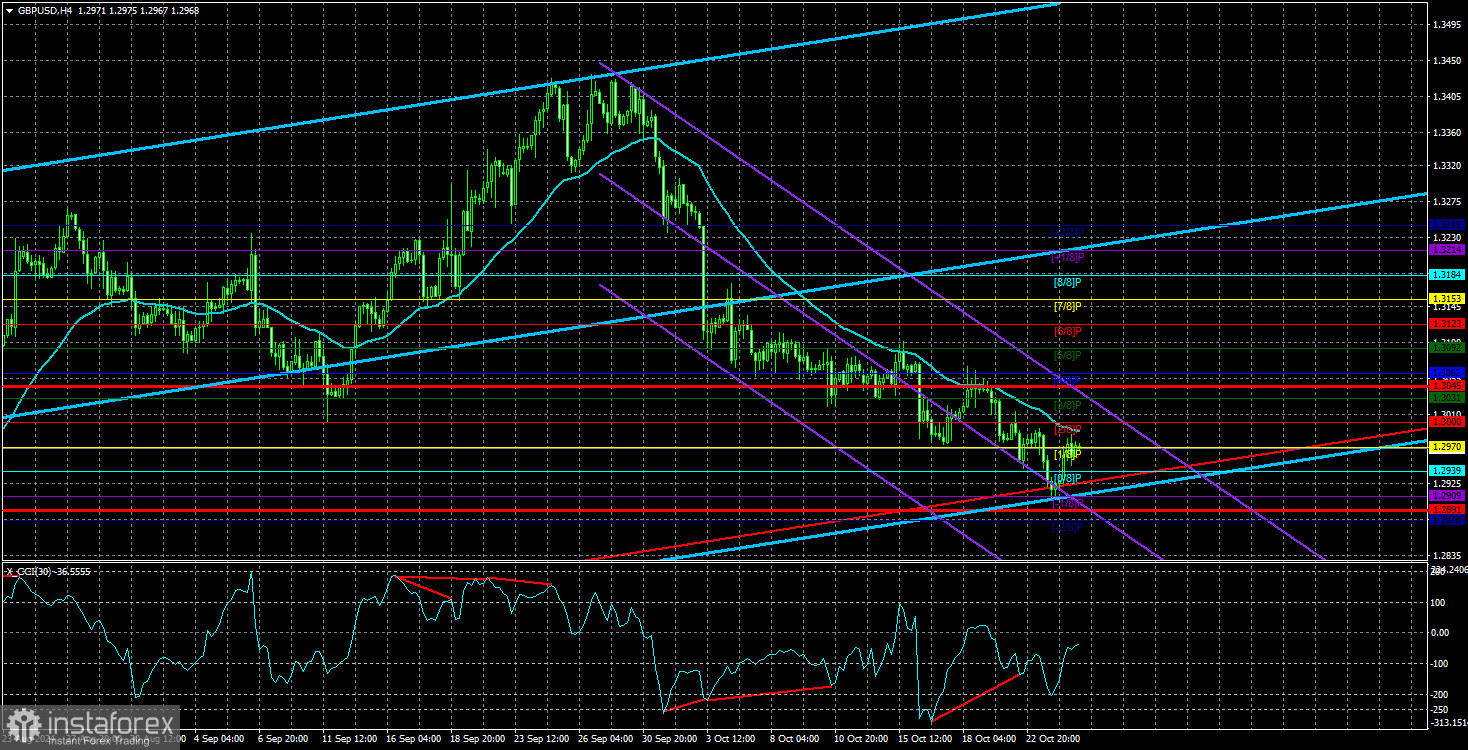
The GBP/USD currency pair saw a slight recovery on Thursday, but the growth of the British currency was too weak to be noteworthy. The price remains near the moving average line, so there is no indication yet of a change in the short-term trend. Even a consolidation above the moving average would only signal the bulls' intentions to start pushing the pair upward soon. However, it's important to note that some reasons are needed for this movement unless we discuss an utterly irrational move like the ones we have seen for much of this year. We must be clear: the pound could rise back to 34 or even up to 40. And it wouldn't necessarily need any solid grounds to do so. It would only require increased demand for the pound, reduced supply, or both. However, as before, we focus only on logical and consistent movements. If fundamentals and macroeconomics don't matter, what is the point of considering them?
Thus, if a movement is illogical and inconsistent, we call it that. Traders must decide if they are ready to engage with such a movement. If trading is based on "pure" technical analysis, then fundamentals and macroeconomics can be disregarded entirely. However, from a technical perspective, the British pound has been in a downtrend for 16 years. Therefore, even from a technical standpoint, it is challenging to expect further strengthening of the British currency, such as a move toward the 40 level.
What can be expected from the British central bank at this point regarding the Bank of England and its monetary policy? It has only lowered the rate once, and the headline inflation has fallen to 1.7%. Yes, core inflation and inflation in the services sector remain high, but how long can the BoE wait for them to slow down? Until headline inflation reaches zero? That's not an option either! Therefore, we believe that, slowly or quickly, the BoE will continue to cut the key rate—likely at each upcoming meeting. Has the market already priced in this scenario, similar to the Federal Reserve? Considering that the pound, like the euro, has been rising for two years, it seems unlikely. Thus, even after a month-long decline, the British pound still has room to fall. Of course, a correction would make things simpler, more straightforward, and more logical. But remember the nature of the movement when the pound was rising! It felt like the price was being pushed upward with all its might. And now, it seems the pressure has been released.
Interestingly, a trendline can be drawn on the daily time frame through all recent lows. It is precisely this trendline that the price "bounced" off this week. However, unlike traditional technical analysis, we believe the third bounce is a precursor to further decline, likely through a correction.
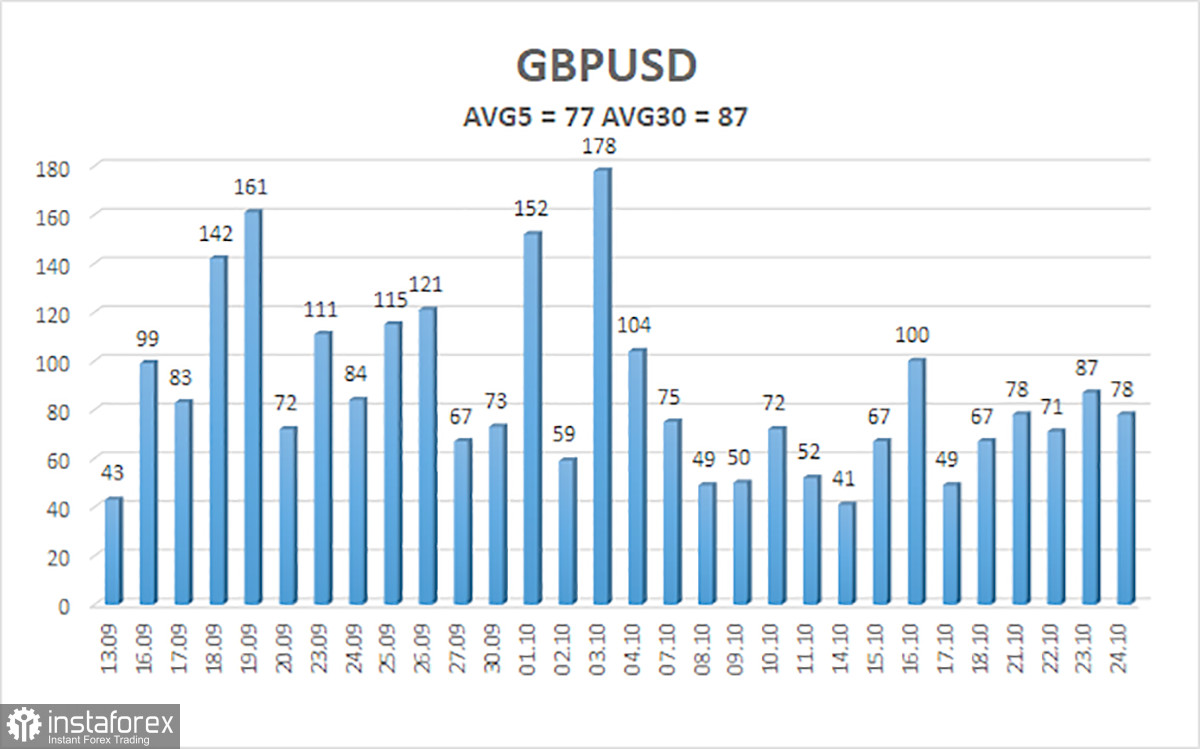
The average volatility of the GBP/USD pair over the last five trading days is 77 pips. For the pound/dollar pair, this value is considered "average." On Friday, October 25, we expect movement within the range defined by levels 1.2891 and 1.3045. The higher linear regression channel is pointing upward, signaling the continuation of the upward trend. The CCI indicator formed six bearish divergences before the decline began. The indicator recently entered the oversold area and formed several bullish divergences, suggesting an upward correction.
Closest support levels:
Closest resistance levels:
The GBP/USD pair maintains a downward trend. We still do not consider long positions, as we believe that all factors supporting the growth of the British currency have already been accounted for by the market multiple times. If you are trading on "pure" technical analysis, long positions are possible with targets at 1.3092 and 1.3123 if the price moves above the moving average line. Short positions are much more relevant now, with targets at 1.2909 and 1.2891. However, a consolidation above the moving average likely indicates a correction, which could take considerable time.
Linear Regression Channels: help determine the current trend. If both are directed the same way, the trend is strong.
Moving Average Line (settings 20,0, smoothed): defines the short-term trend and the direction in which trading should be conducted.
Murray Levels: target levels for movements and corrections.
Volatility Levels (red lines): the likely price range the pair will trade in the next 24 hours, based on current volatility readings.
CCI Indicator: entering the oversold area (below -250) or the overbought area (above +250) signals that a trend reversal in the opposite direction is near.
You have already liked this post today
*The market analysis posted here is meant to increase your awareness, but not to give instructions to make a trade.


