Voir aussi


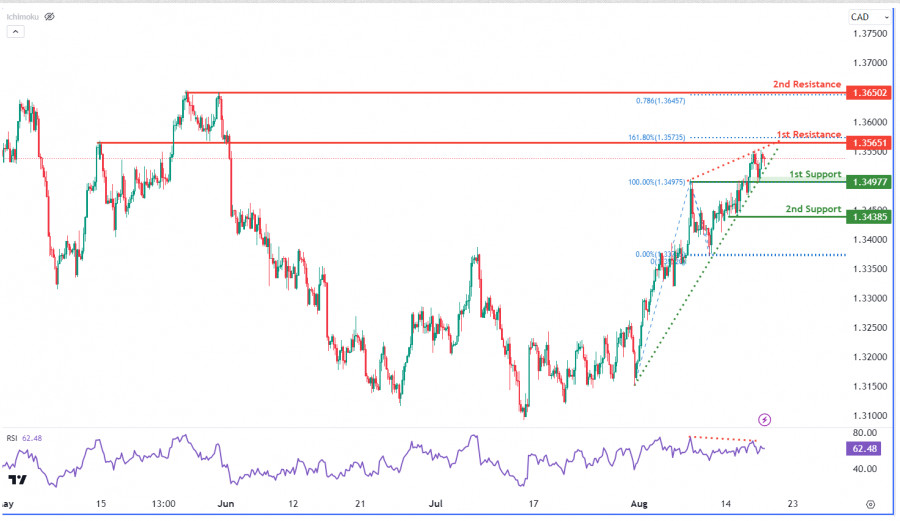
Le graphique USD/CAD montre une tendance baissière, renforcée par un indicateur RSI montrant une divergence baissière avec le prix. Le prix pourrait descendre vers le premier support à 1.3498 et le deuxième support à 1.3387, qui sont tous deux des supports de chevauchement. En revanche, le premier niveau de résistance à 1.3565 correspond à une extension de Fibonacci de 161.80%, et le deuxième niveau de résistance à 1.3650 correspond à une projection de Fibonacci de 78.60%, indiquant un niveau de résistance élevé à plusieurs balancements.
Par ailleurs, un biseau ascendant est un indicateur de retournement souvent observé dans les marchés baissiers. Ce schéma apparaît lorsque les prix augmentent avec des sommets et des creux convergents en direction d'un sommet. S'ils sont associés à un volume décroissant, ils peuvent indiquer une continuation de la tendance baissière.
You have already liked this post today
*The market analysis posted here is meant to increase your awareness, but not to give instructions to make a trade.


Club InstaForex

Your IP address shows that you are currently located in the USA. If you are a resident of the United States, you are prohibited from using the services of InstaFintech Group including online trading, online transfers, deposit/withdrawal of funds, etc.
If you think you are seeing this message by mistake and your location is not the US, kindly proceed to the website. Otherwise, you must leave the website in order to comply with government restrictions.
Why does your IP address show your location as the USA?
Please confirm whether you are a US resident or not by clicking the relevant button below. If you choose the wrong option, being a US resident, you will not be able to open an account with InstaTrade anyway.
We are sorry for any inconvenience caused by this message.

