Lihat juga

 25.10.2024 07:54 AM
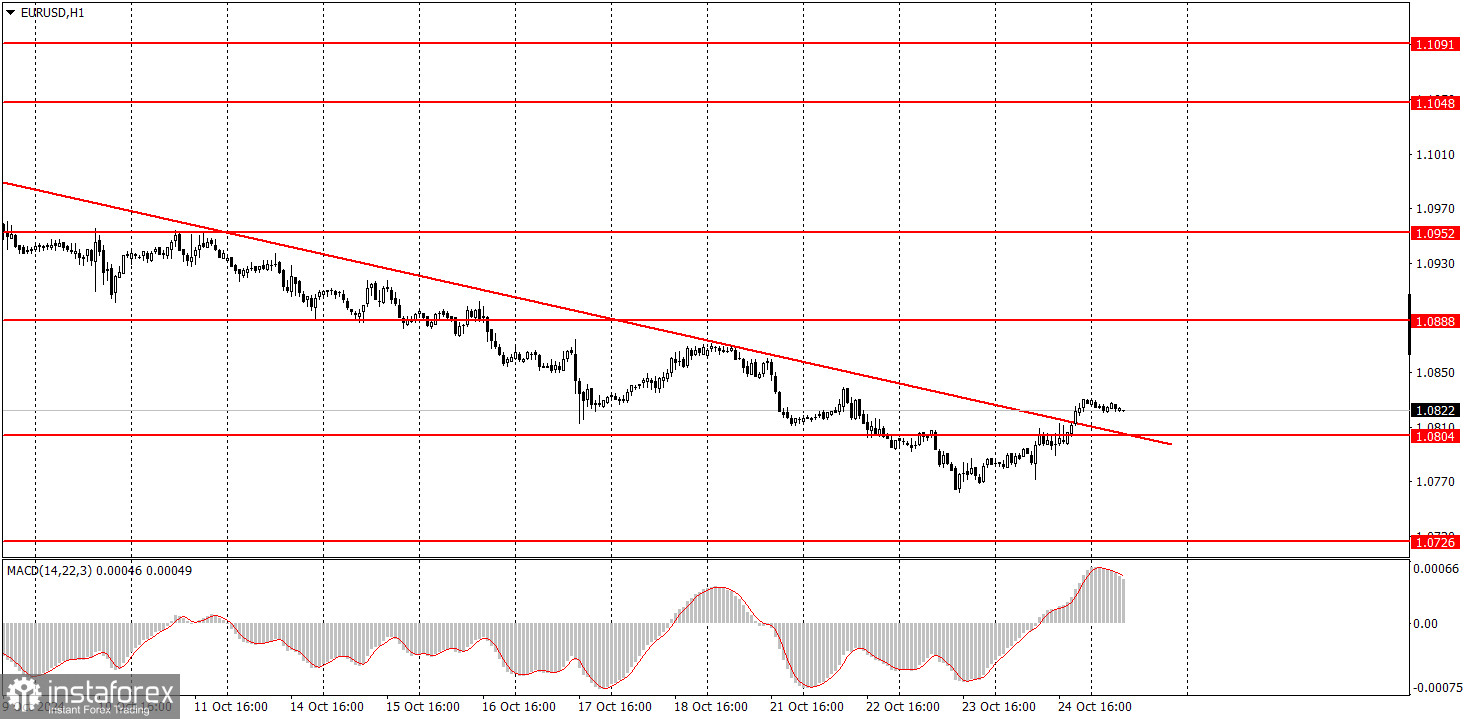
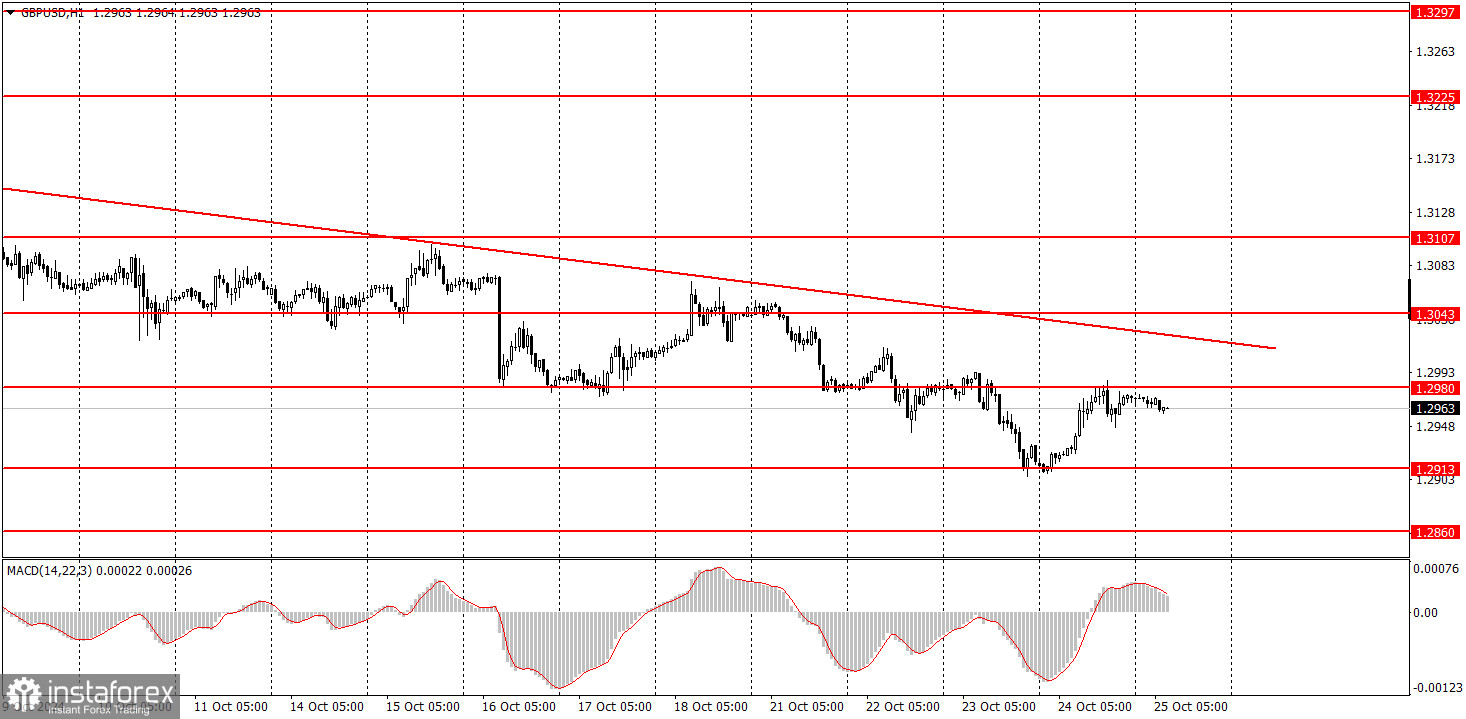
Very few macroeconomic events are scheduled for Friday, but they could influence market sentiment. Yesterday, the euro and the pound showed slight growth, and the EUR/USD pair managed to hold above the trendline. Thus, it can be said that the trend is shifting towards an upward direction. If today's macroeconomic data from the U.S. are weak, the British pound may also break above the trendline, making the case for the euro and pound's growth more convincing. However, if the U.S. reports are strong, both pairs could quickly return to their "bottom." In that case, the trendline breakout for the euro will be deemed false. Today, the U.S. will release reports on durable goods orders and the University of Michigan consumer sentiment index. No significant reports are scheduled in the Eurozone or the UK.
There are no significant fundamental events to note for Friday. No major speeches are planned for today, although several European Central Bank and Federal Reserve representatives have appeared throughout the week. Even Andrew Bailey spoke twice but didn't share anything particularly noteworthy with the market.
On the week's final trading day, both the euro and the pound can resume their decline. Much will depend on today's U.S. data. So far, the euro and the pound have only shown minor depreciation, which cannot confirm the start of a short-term trend. The trendline breakout for the euro could prove to be false. We expect only a continued decline in the euro and the pound in the medium term. A correction may begin, but the pound must also break above the trendline for that to happen.
Support and Resistance Price Levels: These levels serve as targets when opening buy or sell positions. They can also be used as points to set Take Profit levels.
Red Lines: These represent channels or trend lines that display the current trend and indicate the preferred trading direction.
MACD Indicator (14,22,3): The histogram and signal line serve as a supplementary indicator that can also be used as a source of trading signals.
Important Speeches and Reports (always found in the news calendar) can significantly impact the movement of a currency pair. Therefore, trading should be done with maximum caution during their release, or you may choose to exit the market to avoid a sharp price reversal against the preceding movement.
For Beginners Trading on the Forex Market: It's essential to remember that not every trade will be profitable. Developing a clear strategy and practicing money management is key to achieving long-term success in trading.
You have already liked this post today
*Analisis pasar yang diposting disini dimaksudkan untuk meningkatkan pengetahuan Anda namun tidak untuk memberi instruksi trading.


