

Pola sebenarnya

Triple Top
was formed on 03.04 at 04:15:02 (UTC+0)
signal strength 1 of 5
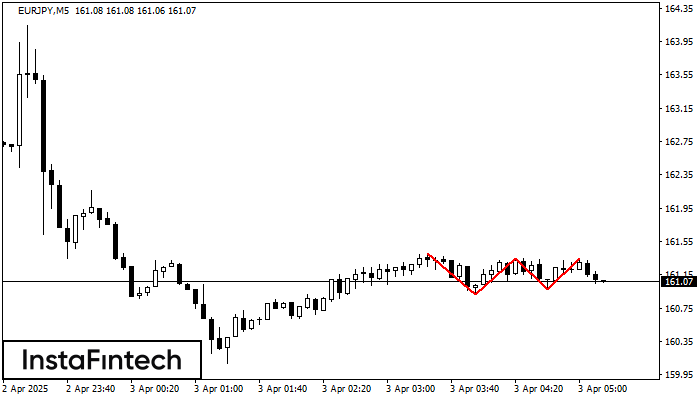
On the chart of the EURJPY M5 trading instrument, the Triple Top pattern that signals a trend change has formed. It is possible that after formation of the third peak, the price will try to break through the resistance level 160.92, where we advise to open a trading position for sale. Take profit is the projection of the pattern’s width, which is 49 points.
The M5 and M15 time frames may have more false entry points.
- All
- All
- Bearish Rectangle
- Bearish Symmetrical Triangle
- Bearish Symmetrical Triangle
- Bullish Rectangle
- Double Top
- Double Top
- Triple Bottom
- Triple Bottom
- Triple Top
- Triple Top
- All
- All
- Buy
- Sale
- All
- 1
- 2
- 3
- 4
- 5
Persegi Bearish
was formed on 18.04 at 13:00:27 (UTC+0)
signal strength 3 of 5

Menurut grafik dari M30, EURGBP terbentuk Persegi Bearish. Jenis pola ini menunjukkan kelanjutan tren. Terdiri dari dua tingkat: resistance 0.8574 - 0.0000 dan support 0.8555 – 0.8555. Jika level resistance
Open chart in a new window
Bawah Triple
was formed on 18.04 at 11:50:33 (UTC+0)
signal strength 1 of 5

Pola Bawah Triple telah terbentuk pada grafik instrumen trading NZDCAD M5. Pola tersebut menandakan perubahan dalam trend dari menurun menjadi naik jika terjadi pemecahan (breakdown) 0.8231/0.8218
Rangka waktu M5 dan M15 mungkin memiliki lebih dari titik entri yang keliru.
Open chart in a new window
Bawah Triple
was formed on 18.04 at 11:45:33 (UTC+0)
signal strength 2 of 5

Pola Bawah Triple telah terbentuk pada NZDJPY M15. Pola tersebut memiliki karakteristik sebagai berikut: level resistance 84.49/84.47; level support 84.31/84.32; dengan lebar 18 poin. Jika terjadi pemecahan (breakdown) pada level
Rangka waktu M5 dan M15 mungkin memiliki lebih dari titik entri yang keliru.
Open chart in a new window

