Pola sebenarnya

Triple Bottom
was formed on 03.04 at 04:50:12 (UTC+0)
signal strength 1 of 5
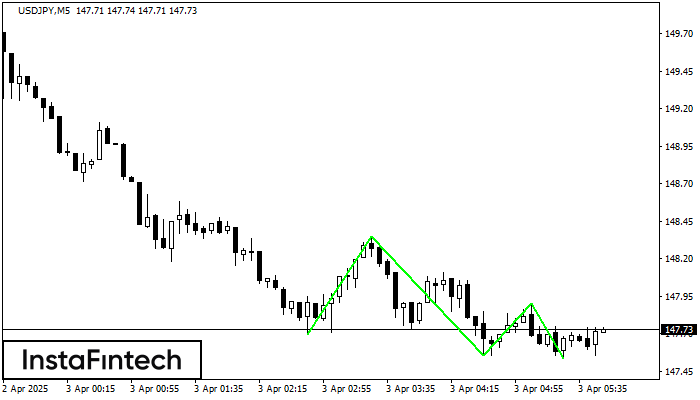
The Triple Bottom pattern has formed on the chart of USDJPY M5. Features of the pattern: The lower line of the pattern has coordinates 148.35 with the upper limit 148.35/147.90, the projection of the width is 65 points. The formation of the Triple Bottom pattern most likely indicates a change in the trend from downward to upward. This means that in the event of a breakdown of the resistance level 147.70, the price is most likely to continue the upward movement.
The M5 and M15 time frames may have more false entry points.
- All
- All
- Bearish Rectangle
- Bearish Symmetrical Triangle
- Bearish Symmetrical Triangle
- Bullish Rectangle
- Double Top
- Double Top
- Triple Bottom
- Triple Bottom
- Triple Top
- Triple Top
- All
- All
- Buy
- Sale
- All
- 1
- 2
- 3
- 4
- 5
Segitiga Simetris Bullish
was formed on 18.04 at 21:02:57 (UTC+0)
signal strength 2 of 5

Menurut Grafik dari M15, EURJPY dibentuk pola Segitiga Simetris Bullish, yang menunjukkan tren akan berlanjut. Deksripsi. Batas atas dari pola menyentuh kordinat 162.14/161.96 dimana batas yang lebih rendah berada sepanjang
Rangka waktu M5 dan M15 mungkin memiliki lebih dari titik entri yang keliru.
Open chart in a new window
Segitiga Simetris Bullish
was formed on 18.04 at 20:46:25 (UTC+0)
signal strength 1 of 5

Menurut Grafik dari M5, EURJPY dibentuk pola Segitiga Simetris Bullish, yang menunjukkan tren akan berlanjut. Deksripsi. Batas atas dari pola menyentuh kordinat 162.14/161.98 dimana batas yang lebih rendah berada sepanjang
Rangka waktu M5 dan M15 mungkin memiliki lebih dari titik entri yang keliru.
Open chart in a new window
Bawah Triple
was formed on 18.04 at 20:20:31 (UTC+0)
signal strength 1 of 5

Pola Bawah Triple telah terbentuk pada GBPAUD M5. Pola tersebut memiliki karakteristik sebagai berikut: level resistance 2.0835/2.0826; level support 2.0821/2.0823; dengan lebar 14 poin. Jika terjadi pemecahan (breakdown) pada level
Rangka waktu M5 dan M15 mungkin memiliki lebih dari titik entri yang keliru.
Open chart in a new window