यह भी देखें

 24.10.2024 07:58 AM
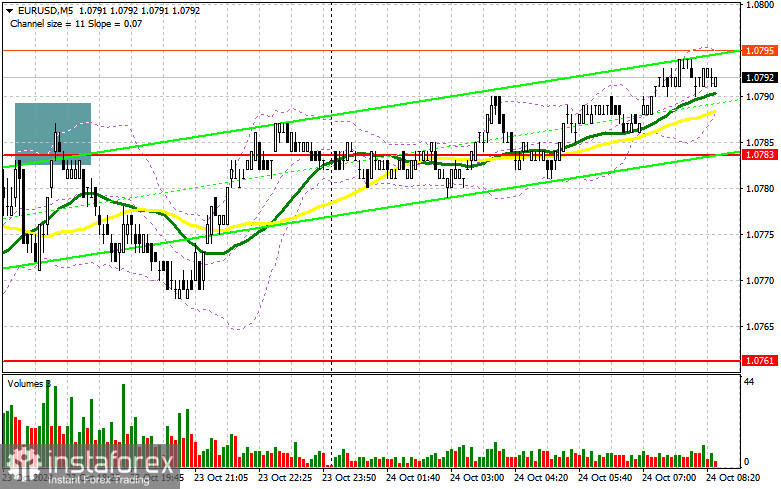
Yesterday, several suitable entry points into the market were formed. Let's look at the 5-minute chart and analyze what happened. I highlighted the 1.0783 level in my morning forecast and planned to use it for entry decisions. A decline and a false breakout at this level provided an excellent buy entry point, but as you can see on the chart, it did not lead to significant growth in the pair. Shortly afterward, the euro continued to fall, leading to a new low of 1.0761 with a similar entry point. This time, the pair bounced up by 20 pips and, at the time of writing, continues to rise. In the second half of the day, sales on a false breakout near 1.0783 showed a 15-pip downward movement, which was the end.
To open long positions on EUR/USD, the following is required:
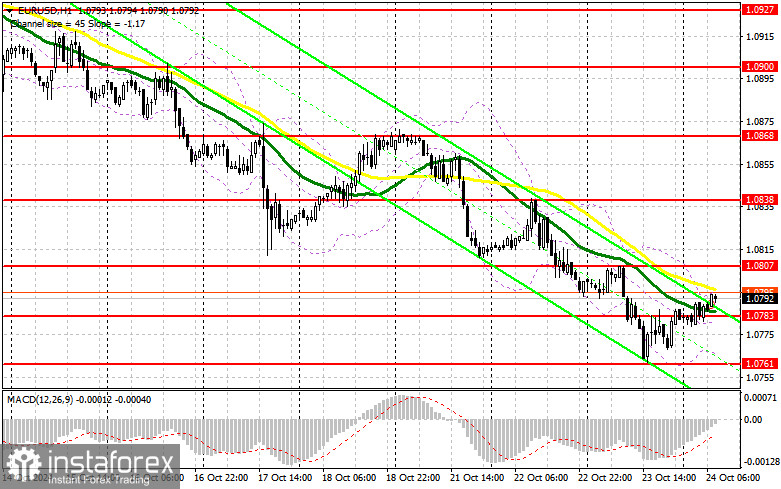
The fact that the euro recovered slightly from the monthly low does not mean real buyers have entered the market. Only today's strong data for October on the Eurozone Manufacturing PMI, Services PMI, and Composite PMI could provide the necessary support for the euro. However, given the recent worsening conditions in the manufacturing sector, relying heavily on these figures is not advisable. In case of an adverse reaction and further decline of the pair, only a false breakout around the 1.0783 low would be suitable for building long positions, potentially opening the way to 1.0807. A breakout and retest of this range confirm a correct buy entry point, aiming for a retest of 1.0838. The furthest target would be the 1.0868 high, where I plan to take profits. If EUR/USD declines further and no activity near 1.0783 in the first half of the day, pressure on the euro will remain. In this case, I will only consider entries after a false breakout near the next support at 1.0761, which is the channel's lower boundary and the monthly low. I plan to open long positions immediately on a bounce from 1.0738, aiming for a 30-35 pip upward correction during the day.
To open short positions on EUR/USD, the following is required:
Sellers maintain control over the market, achieving new monthly lows daily, which indicates a bearish market. In case of an upward move in EUR/USD during the first half of the day following PMI data, only a false breakout near the 1.0807 resistance will provide a good entry point for opening new short positions, with the prospect of a decline to the 1.0783 support where the moving averages are located. A breakout and consolidation below this range and a retest from below would provide another good selling opportunity, targeting the 1.0761 area, which would further strengthen the bearish market. Only there do I expect a more active response from the bulls. The furthest target would be the 1.0738 area, where I plan to take profits. If EUR/USD moves up in the first half of the day and sellers fail to appear at 1.0807, buyers will have a chance to strengthen the pair slightly. In this case, I will delay selling until testing the next resistance at 1.0838. I will also sell there, but only after a failed consolidation. I plan to open short positions immediately on a bounce from 1.0868, aiming for a 30-35 pip downward correction.
Recommended Reading:
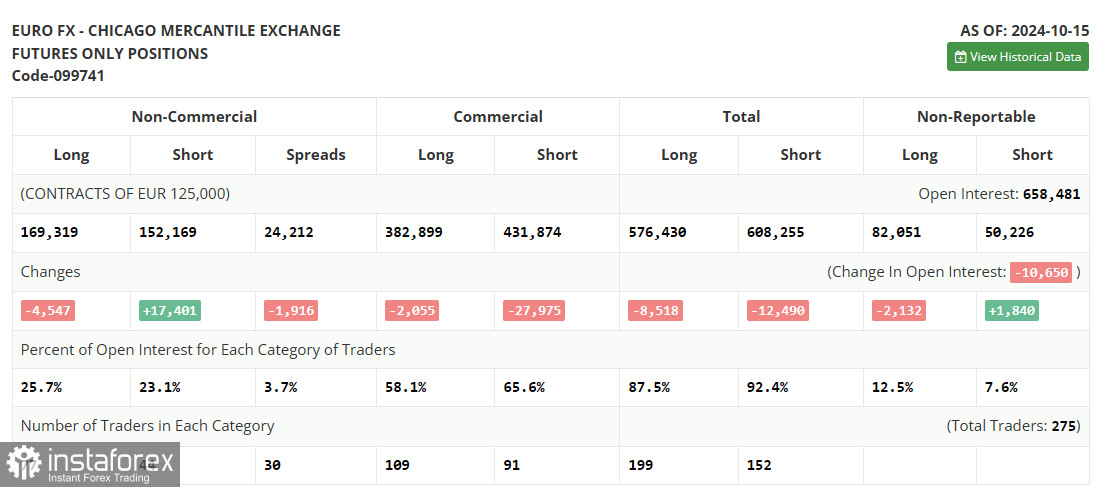
The COT report (Commitment of Traders) for October 15 showed a sharp increase in short positions and another decrease in long positions. It's clear that the data already includes the recent European Central Bank decision to lower rates, and the focus on more aggressive policy easing by the end of the year from the ECB has led to a shift in market dynamics. Buyers of risky assets are no longer leading strongly, and the balance of power is nearly equal: 169,319 versus 152,169. This week is expected to be relatively calm, as there is almost no critical data, so the focus will remain on the bearish trend for the euro. The COT report shows that long non-commercial positions decreased by 4,547 to 169,319, while short non-commercial positions increased by 17,401 to 152,169. As a result, the spread between long and short positions narrowed by 1,402.
Indicator Signals:
Moving Averages:
Trading occurs near the 30- and 50-day moving averages, indicating market uncertainty.
Note: The author considers the period and prices of moving averages on the H1 hourly chart, which differs from the standard definition of classic daily moving averages on the D1 chart.
Bollinger Bands:
In the event of a decline, the indicator's lower boundary, around 1.0761, will serve as support.
Indicator Descriptions:
You have already liked this post today
*यहां पर लिखा गया बाजार विश्लेषण आपकी जागरूकता बढ़ाने के लिए किया है, लेकिन व्यापार करने के लिए निर्देश देने के लिए नहीं |


