Lihat juga

 25.10.2024 04:49 PM
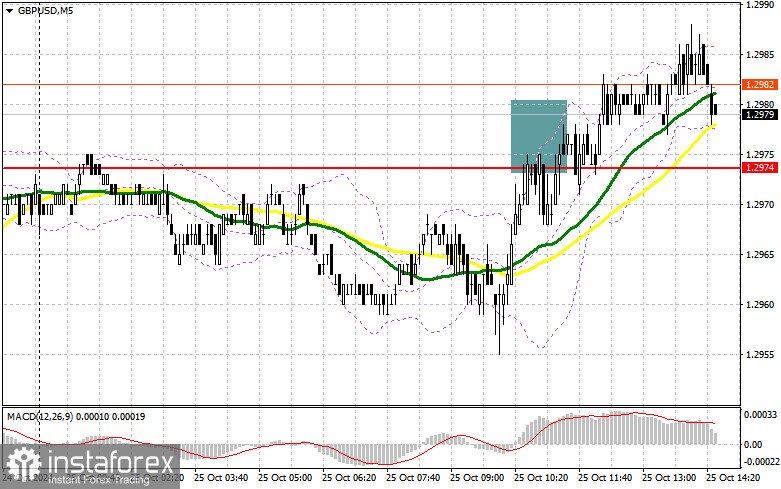
In my morning forecast, I focused on the 1.2974 level and planned to make entry decisions based on it. Let's look at the 5-minute chart and analyze what happened there. The rise and formation of a false breakout confirmed a good entry point for selling, though it didn't lead to a trade. The technical outlook was slightly revised for the second half of the day.
To Open Long Positions on GBP/USD:
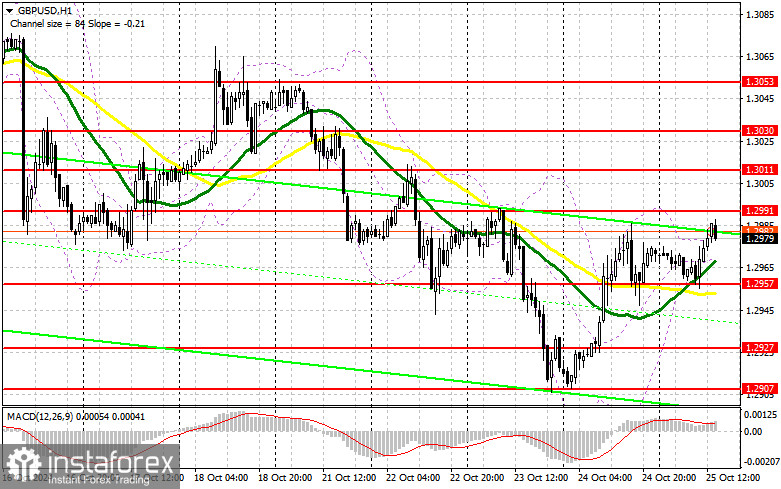
In the second half of the day, we await data on changes in U.S. durable goods orders and the University of Michigan consumer sentiment index. Only very strong data could weaken the British pound, which I plan to take advantage of. If the pair declines, only a false breakout formation around the new support at 1.2957 will confirm a good entry point for long positions, aiming for a retest of 1.2991, which was not reached in the first half of the day. A breakout followed by a retest of 1.2991 would lead to a new entry point for long positions, with the potential to reach 1.3011. The upper target would be the 1.3030 level, where I plan to take profits. If GBP/USD falls and buying interest is absent around 1.2957 in the second half of the day, the bearish market will return. This would also lead to a decline and a retest of the next support at 1.2927. Only a false breakout there would provide a suitable condition for opening long positions. I plan to buy GBP/USD directly on a rebound from the 1.2907 low, aiming for an intraday correction of 30-35 points.
To Open Short Positions on GBP/USD:
Sellers attempted to push the price down but were unsuccessful. Now, it's crucial not to miss the nearby resistance at 1.2991, which could be tested soon. US data releases could support this move, and a false breakout around 1.2991 would be a suitable selling opportunity, aiming for a decline toward the 1.2957 support. A breakout followed by a bottom-to-top retest of this range would pressure buyers' positions, triggering stop orders and opening the path to 1.2927. The next target would be the 1.2907 level, where I plan to take profits. A test of this level would reinforce the bearish trend. If GBP/USD rises in the second half of the day and buying interest is absent around 1.2991—which is more likely, especially in the context of strong US data and the absence of large sellers' reactions—buyers could continue to recover their positions. Bears would then have no choice but to retreat to the 1.3011 resistance area. I will only sell there on a false breakout. If there is no downward movement at that level either, I will look for short positions on a rebound around 1.3030, aiming for a downward correction of 30-35 points.
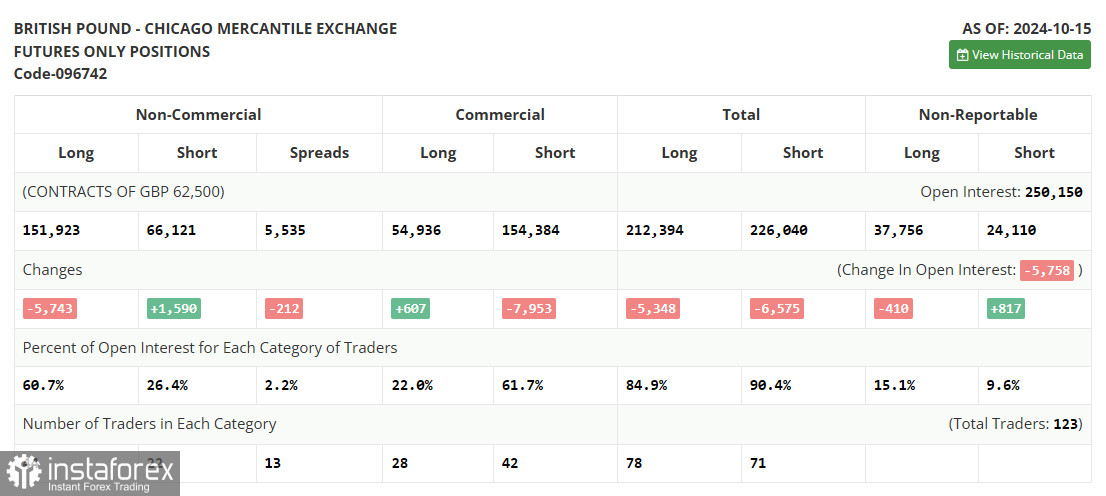
The COT (Commitment of Traders) report from October 15 showed a reduction in long positions and an increase in short ones. However, this did not significantly affect the balance between buyers and sellers, with the former still outnumbering the latter by nearly two and a half times. Data on the UK labor market and inflation have negatively impacted the pound's upward potential, as everything points to a further rate cut in the UK, which is also unfavorable for the national currency. There is no important data this week, so everyone will closely follow the statements of Bank of England representatives, which could help clarify the regulator's future policy. The latest COT report indicated that long non-commercial positions fell by 5,743 to 151,923, while short non-commercial positions increased by 1,590 to 66,121. As a result, the gap between long and short positions decreased by 212.
Indicator Signals:
Moving Averages:
Trading is taking place above the 30- and 50-day moving averages, indicating further growth potential for the pair.
Note: The periods and prices of moving averages are considered by the author on the H1 hourly chart and differ from the classical definition of daily moving averages on the D1 daily chart.
Bollinger Bands:
In the event of a decline, the lower boundary of the indicator around 1.2957 will serve as support.
Indicator Descriptions:
You have already liked this post today
* Analisis pasaran yang disiarkan di sini adalah bertujuan untuk meningkatkan kesedaran anda, tetapi tidak untuk memberi arahan untuk membuat perdagangan.


