Corak sebenar

Double Bottom
was formed on 28.03 at 22:15:04 (UTC+0)
signal strength 2 of 5
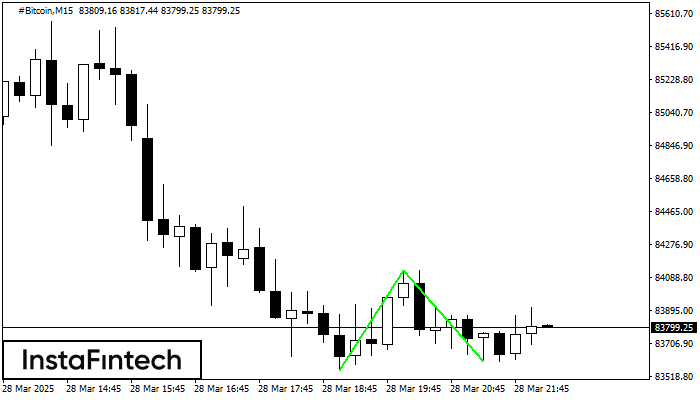
The Double Bottom pattern has been formed on #Bitcoin M15. Characteristics: the support level 83552.05; the resistance level 84127.84; the width of the pattern 57579 points. If the resistance level is broken, a change in the trend can be predicted with the first target point lying at the distance of 52661 points.
The M5 and M15 time frames may have more false entry points.
- All
- All
- Bearish Rectangle
- Bearish Symmetrical Triangle
- Bearish Symmetrical Triangle
- Bullish Rectangle
- Double Top
- Double Top
- Triple Bottom
- Triple Bottom
- Triple Top
- Triple Top
- All
- All
- Buy
- Sale
- All
- 1
- 2
- 3
- 4
- 5
Head and Shoulders
сформирован 18.04 в 18:05:18 (UTC+0)
сила сигнала 1 из 5

The EURJPY M5 formed the Head and Shoulders pattern with the following features: The Head’s top is at 162.14, the Neckline and the upward angle are at 161.98/161.96. The formation
The M5 and M15 time frames may have more false entry points.
Открыть график инструмента в новом окне
Double Bottom
сформирован 18.04 в 18:05:13 (UTC+0)
сила сигнала 1 из 5
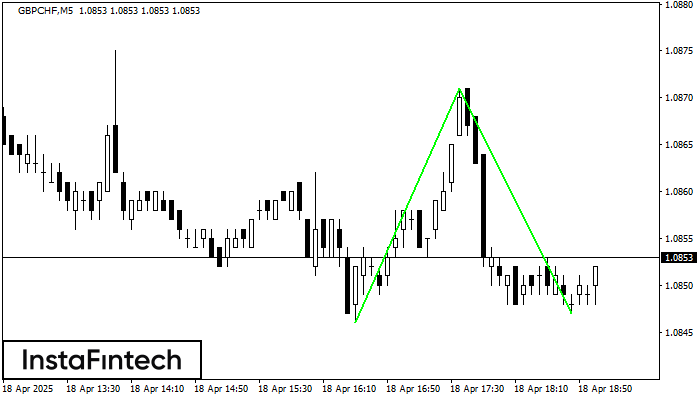
The Double Bottom pattern has been formed on GBPCHF M5. This formation signals a reversal of the trend from downwards to upwards. The signal is that a buy trade should
The M5 and M15 time frames may have more false entry points.
Открыть график инструмента в новом окне
Triple Top
сформирован 18.04 в 18:00:33 (UTC+0)
сила сигнала 3 из 5
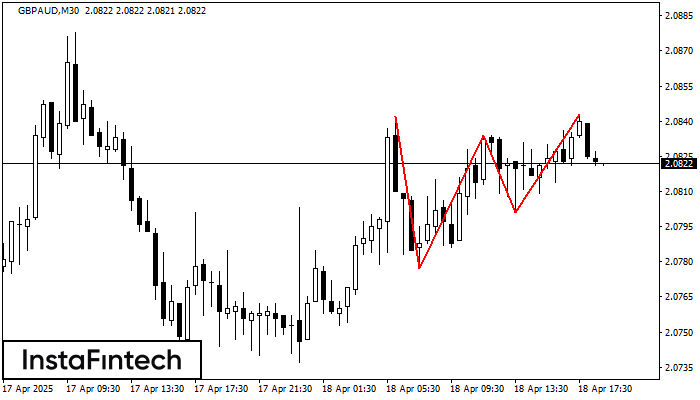
The Triple Top pattern has formed on the chart of the GBPAUD M30. Features of the pattern: borders have an ascending angle; the lower line of the pattern
Открыть график инструмента в новом окне