Corak sebenar

Bearish Symmetrical Triangle
was formed on 31.03 at 12:11:40 (UTC+0)
signal strength 1 of 5
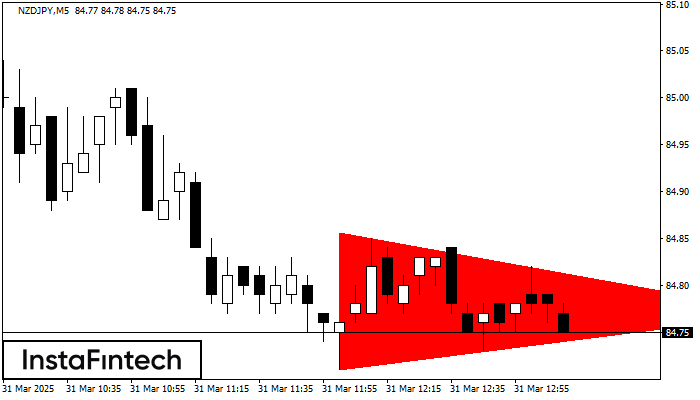
According to the chart of M5, NZDJPY formed the Bearish Symmetrical Triangle pattern. Trading recommendations: A breach of the lower border 84.71 is likely to encourage a continuation of the downward trend.
The M5 and M15 time frames may have more false entry points.
Juga lihat
- All
- All
- Bearish Rectangle
- Bearish Symmetrical Triangle
- Bearish Symmetrical Triangle
- Bullish Rectangle
- Double Top
- Double Top
- Triple Bottom
- Triple Bottom
- Triple Top
- Triple Top
- All
- All
- Buy
- Sale
- All
- 1
- 2
- 3
- 4
- 5
Triple Top
was formed on 14.04 at 15:00:11 (UTC+0)
signal strength 3 of 5
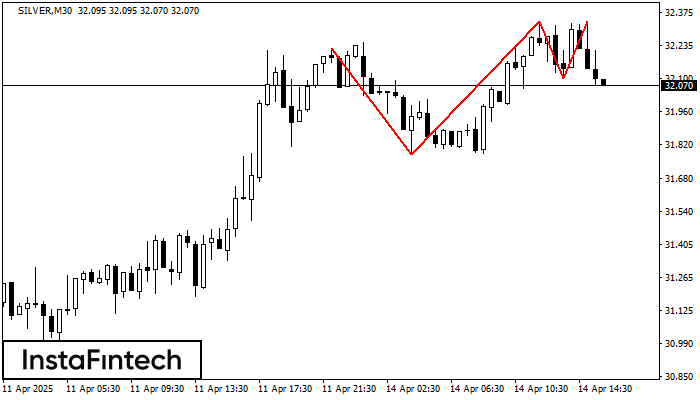
The Triple Top pattern has formed on the chart of the SILVER M30. Features of the pattern: borders have an ascending angle; the lower line of the pattern
Open chart in a new window
Bullish Rectangle
was formed on 14.04 at 15:00:08 (UTC+0)
signal strength 1 of 5
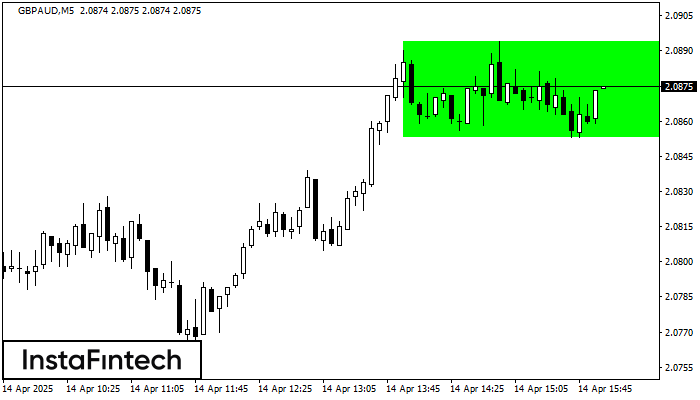
According to the chart of M5, GBPAUD formed the Bullish Rectangle. This type of a pattern indicates a trend continuation. It consists of two levels: resistance 2.0894 and support 2.0853
The M5 and M15 time frames may have more false entry points.
Open chart in a new window
Double Bottom
was formed on 14.04 at 14:45:10 (UTC+0)
signal strength 1 of 5
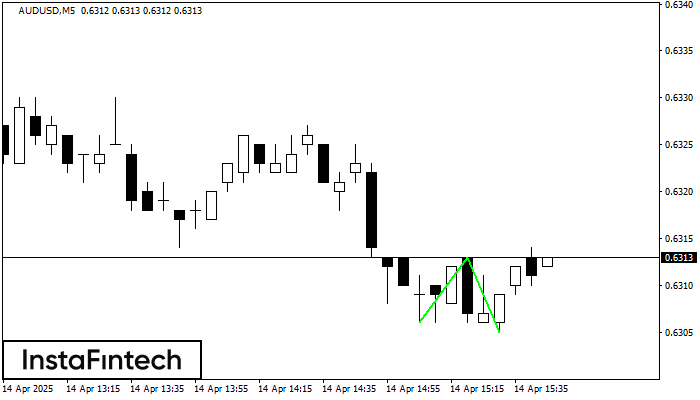
The Double Bottom pattern has been formed on AUDUSD M5; the upper boundary is 0.6313; the lower boundary is 0.6305. The width of the pattern is 7 points. In case
The M5 and M15 time frames may have more false entry points.
Open chart in a new window