یہ بھی دیکھیں

 24.10.2024 03:49 AM
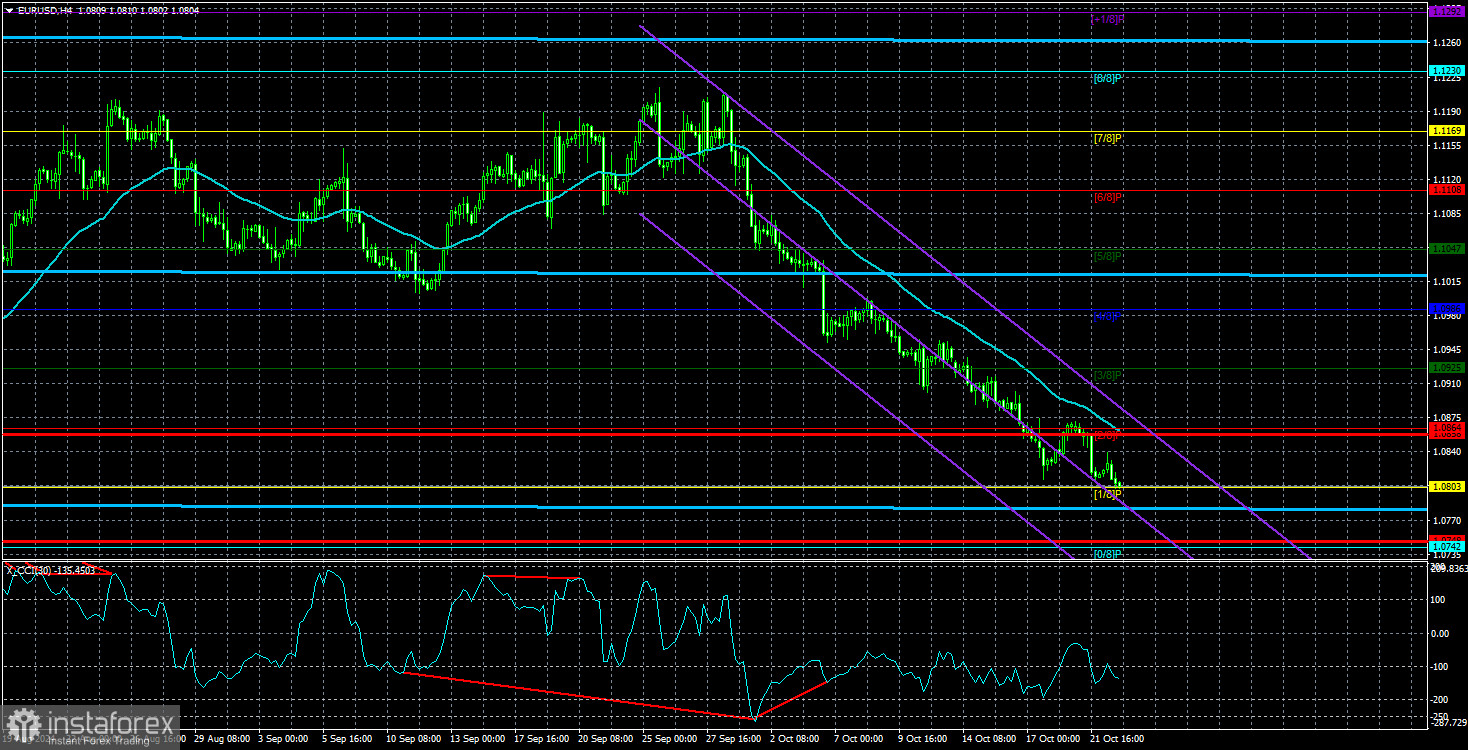
The EUR/USD currency pair continued to trade lower on Wednesday. To be honest, the current movement only makes us smile. Throughout almost all of 2024, we repeatedly saw "explanations" for the rise of the euro that seemed to be pulled "out of thin air." We want to remind you that most experts explain past movements after the fact. Only some are willing to state that a currency's movement is illogical and unjustifiably expensive. So now, as we observe the daily decline of the euro for almost a month, we can only remind you that we warned about its unjustified overvaluation. The dollar did not have enough reasons to fall, and the euro didn't have enough to rise.
Furthermore, the market has been pricing in future Federal Reserve easing and a recession in the US over the past two years (or at least throughout 2024) while ignoring other factors. Incidentally, the recession never happened. According to many members of the Fed's monetary committee, the US labor market is doing fine, and the unemployment rate is within a normal range. Thus, they say, the factors that caused the market to panic and sell off the dollar "weren't worth a dime."
Now, we are witnessing a fully justified decline in the euro. The easing of the Fed's monetary policy is already wholly or nearly fully priced in, as the market began selling the dollar two years ago when US inflation first started to slow down. But now (about a month ago), the market "remembered" that the European Central Bank is also easing its monetary policy. Moreover, the ECB is currently cutting rates even faster than the Fed. Additionally, the ECB's rate was initially 1% lower. As a result, new factors for the euro's decline keep emerging, while the dollar lacks such factors. Yesterday, we mentioned that Donald Trump's potential return should not be seen as a reason for the rise or fall of the US dollar. For instance, during Trump's first term, the dollar neither rose significantly nor fell.
Moreover, yesterday and the day before, Christine Lagarde "added fuel to the fire" by stating that monetary policy would continue to become more accommodative, and the ECB does not rule out a 0.5% rate cut at one of the upcoming meetings. We are seeing the euro decline almost every day because of the combination of all these factors. We won't deny that we also expect a correction, but overall, the euro could continue to fall comfortably to the 1.0435 level, where the lower boundary of the one-and-a-half-year horizontal channel lies on the weekly time frame. Who says the price has to correct? For a weekly chart, a movement of 700-750 pips is insignificant.
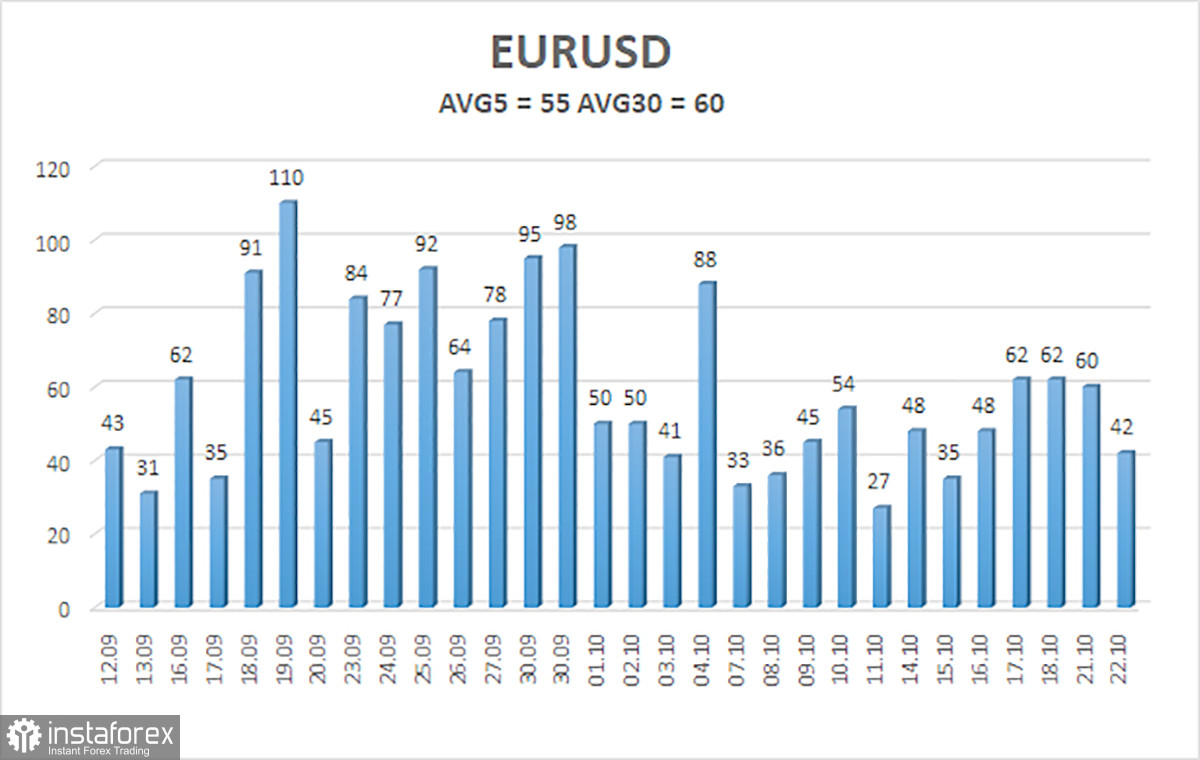
The average volatility of the EUR/USD currency pair over the last five trading days as of October 24 is 55 pips, characterized as "low." We expect the pair to move between the levels of 1.0728 and 1.0838 on Thursday. The higher linear regression channel points upward, but the overall downward trend remains. After a series of moves into the overbought area, the CCI indicator has entered the oversold area and already formed several bullish divergences—suggesting that a correction is brewing. However, it might start later.
Nearest Support Levels:
Nearest Resistance Levels:
The EUR/USD pair continues its downward movement. In recent weeks, we have only expected a decline from the euro from a medium-term perspective, so we fully support the downward trend. Likely, the market has already priced in all or nearly all of the future Fed rate cuts. If that's the case, then the dollar no longer has reasons to fall, although there weren't many before. Short positions can still be considered with targets at 1.0742 and 1.0728 if the price is below the moving average. If you trade based on "pure" technicals, then long positions will be relevant when the price is above the moving average line. However, soon, such consolidation would only signal a correction.
Linear Regression Channels: help determine the current trend. If both are directed the same way, the trend is strong.
Moving Average Line (settings 20,0, smoothed): defines the short-term trend and the direction in which trading should be conducted.
Murray Levels: target levels for movements and corrections.
Volatility Levels (red lines): the likely price range the pair will trade in the next 24 hours, based on current volatility readings.
CCI Indicator: entering the oversold area (below -250) or the overbought area (above +250) signals that a trend reversal in the opposite direction is near.
You have already liked this post today
*تعینات کیا مراد ہے مارکیٹ کے تجزیات یہاں ارسال کیے جاتے ہیں جس کا مقصد آپ کی بیداری بڑھانا ہے، لیکن تجارت کرنے کے لئے ہدایات دینا نہیں.


