یہ بھی دیکھیں

 24.10.2024 03:57 PM
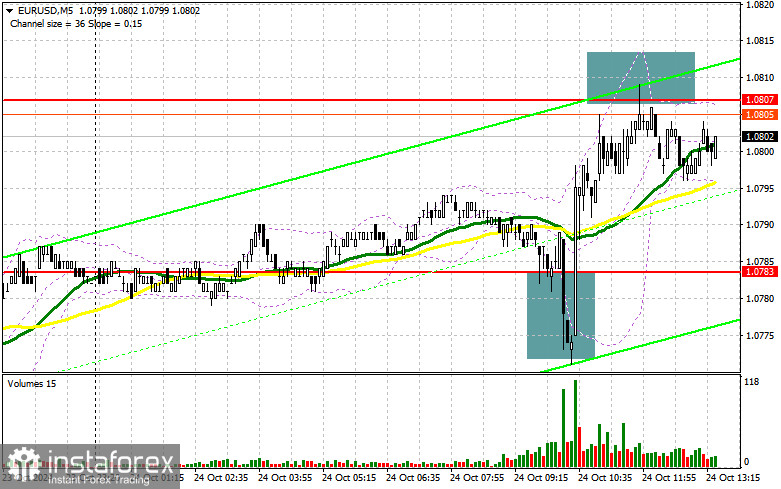
In my morning forecast, I focused on the level of 1.0783 and planned to base my trading decisions on it. Let's look at the 5-minute chart and analyze what happened. The decline and the formation of a false breakout provided an excellent entry point for a buy, resulting in a 20-point rise. Sell positions around 1.0807 on a false breakout remain relevant at the time of writing. The technical picture for the second half of the day remains unchanged.
To open long positions on EUR/USD:
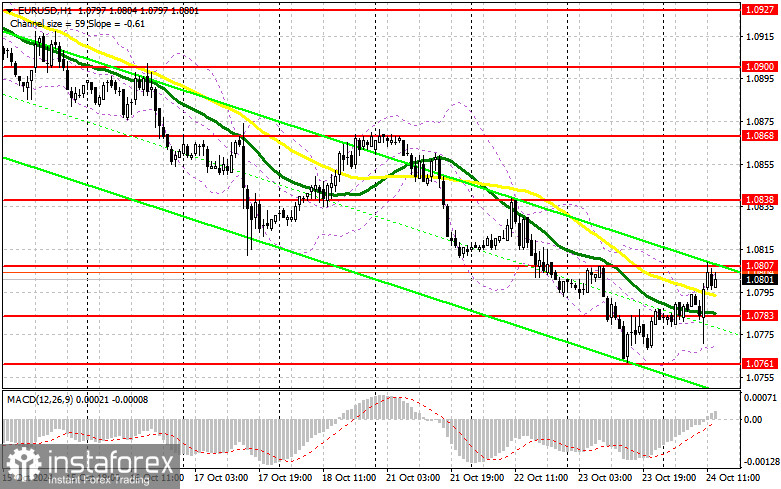
The relatively positive PMI activity index data in the Eurozone helped the euro recover in the first half of the day, but active buying has not yet occurred. It is quite possible that similarly weak data on the U.S. manufacturing PMI, services PMI, initial jobless claims, and new home sales could help the euro continue to rise, but the numbers would need to be significantly worse than economists' forecasts. If the pair declines as a reaction to the data, actions will be taken only around the morning support level of 1.0783, similar to the scenario discussed earlier. The formation of a false breakout there would be a suitable condition for building up long positions, opening the path back to the level of 1.0807. A breakout and retest of this range would confirm a correct entry point for purchases, targeting 1.0838. The ultimate target would be the high of 1.0868, where I plan to take profits. In the event of a decline in EUR/USD and a lack of activity around 1.0783 in the second half of the day, the pair will return to the monthly low, which will pose many challenges for buyers. In such a case, I will only enter a position after forming a false breakout near the next support levels of 1.0761 and 1.0738. I plan to open long positions immediately on a rebound from 1.0711, aiming for an upward correction of 30-35 points within the day.
To open short positions on EUR/USD:
Bears have retreated slightly, but this is not surprising given the data. In the event of another rise in the pair following the U.S. reports, a false breakout near 1.0807, similar to the situation analyzed earlier, would provide an entry point for short positions with the potential for further decline to the support at 1.0783—the middle of the sideways channel, where the moving averages are located. A breakout and consolidation below this range, as well as a retest from below, would be another suitable opportunity for a sell, targeting the 1.0761 level, which would further strengthen the bearish market. At this level, I expect to see more active buying. The ultimate target would be the level of 1.0738, where I will take profits. If EUR/USD rises in the second half of the day, and bears are absent at 1.0807—especially since this level has already been tested once—buyers could have a chance for a correction. In such a case, I will postpone selling until the next resistance test at 1.0838. I will also sell there, but only after an unsuccessful consolidation. I plan to open short positions immediately on a rebound from 1.0868, aiming for a downward correction of 30-35 points.
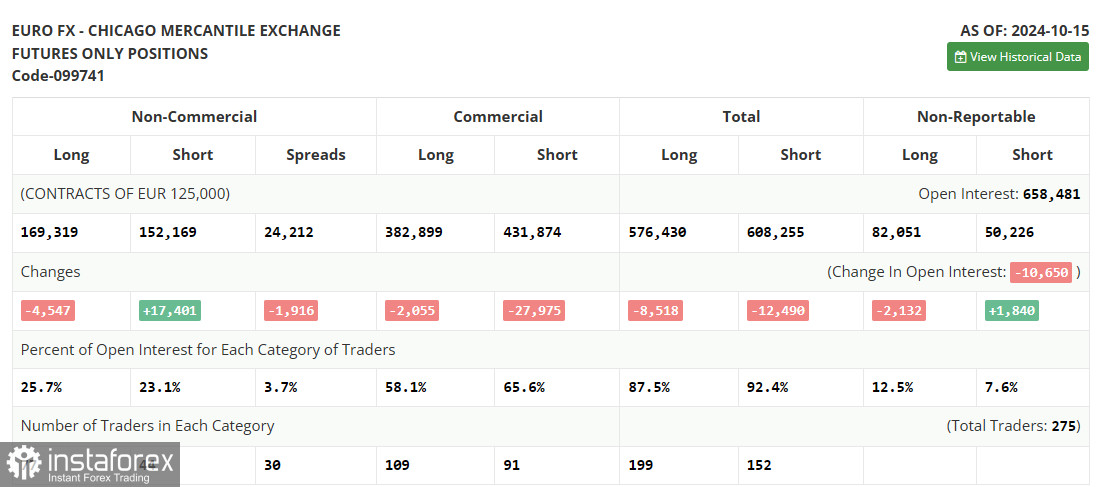
In the COT report (Commitment of Traders) for October 15, short positions increased sharply, and there was another reduction in long positions. It is evident that the data already reflect the recent decision by the European Central Bank to cut rates, with an emphasis on a more aggressive monetary easing policy by the end of the year, which has clearly led to a shift in market dynamics. Now, buyers of risk assets have lost some of their earlier momentum, and the balance of power has nearly equalized: 169,319 versus 152,169. This week is expected to be relatively calm, as there is little significant economic data; therefore, the bearish market for the euro is likely to continue. The COT report indicates that long non-commercial positions decreased by 4,547 to 169,319, while short non-commercial positions increased by 17,401 to 152,169. As a result, the gap between long and short positions narrowed by 1,402 contracts.
Signals from Indicators:
Moving Averages:
Trading is conducted slightly above the 30- and 50-day moving averages, indicating a correction in the pair.
Note: The period and prices of moving averages are considered by the author on the hourly H1 chart and differ from the general definition of classic daily moving averages on the daily D1 chart.
Bollinger Bands:
In the event of a decline, the lower boundary of the indicator at around 1.0771 will serve as support.
Indicator Descriptions:
You have already liked this post today
*تعینات کیا مراد ہے مارکیٹ کے تجزیات یہاں ارسال کیے جاتے ہیں جس کا مقصد آپ کی بیداری بڑھانا ہے، لیکن تجارت کرنے کے لئے ہدایات دینا نہیں.


