empty
22.02.2023 01:03 AM
Technical analysis of EUR/USD for February 21, 2023

This image is no longer relevant

Overview :

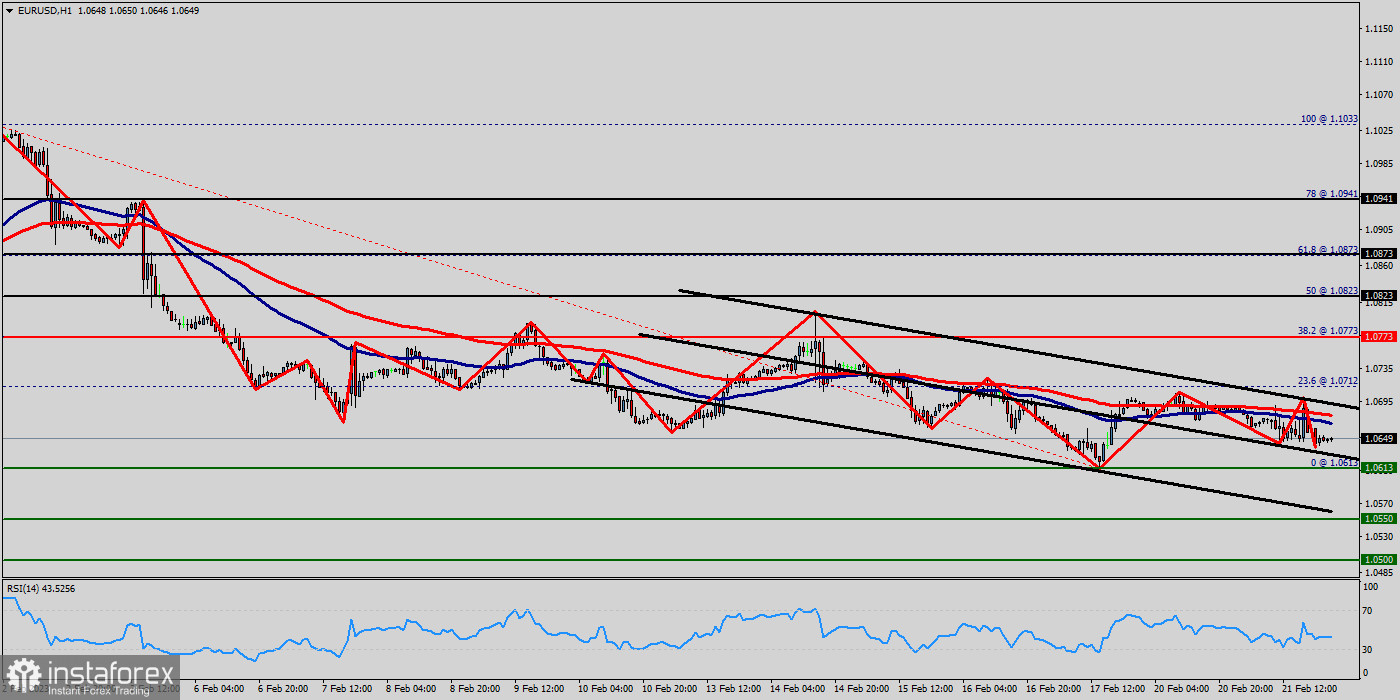
The EUR/USD pair continues to move downwards from the level of 1.0733. Yesterday, the pair dropped from the level of 1.0733 (this level of 1.0733 coincides with the double top - 38.2% of Fibonacci retracement levels) to the bottom around 1.0649. Today, the first resistance level is seen at 1.0712 followed by 1.0733 (the daily pivot point), while daily support 1 is found at 1.0613.

Also, the level of 1.0733 represents a weekly pivot point for that it is acting as major resistance/support this week. Amid the previous events, the pair is still in a downtrend, because the EUR/USD pair is trading in a bearish trend from the new resistance line of 1.0785 towards the first support level at 1.0670 in order to test it. If the pair succeeds to pass through the level of 1.0670, the market will indicate a bearish opportunity below the level of 1.0670.

So, we expect the price to set below the strong (first) support at the level of 1.0670; because the price is in a bearish channel now. The RSI starts signaling a downward trend. Consequently, the market is likely to show signs of a bearish trend. If the trend breaks the major support at 1.0670, the pair will move downwards continuing the bearish trend development to the level 1.0623 in order to test the daily support 2.

The EUR/USD pair is showing signs of strength following a breakout of the lowest level of 1.0550. The market is indicating a bearish opportunity above the above-mentioned support levels, for that the bearish outlook remains the same as long as the 100 EMA is headed to the downside. However, if a breakout happens at the resistance level of 1.0733, then this scenario may be invalidated.

Recommended Stories

Análise técnica do movimento intradiário de preços do AUD/JPY, quarta-feira, 23 de abril de 2025

Com a presença de uma divergência entre o movimento de preços do par AUD/JPY e o indicador Stochastic Oscillator, além do preço estar acima da média móvel ponderada (WMA)

Arief Makmur 16:00 2025-04-23 UTC+2

Análise técnica do movimento intradiário do preço do ouro, quarta-feira, 23 de abril de 2025

Ao observar o gráfico de 4 horas, o ouro ainda apresenta viés de alta. No entanto, a divergência entre o movimento de preços do ouro e o indicador Stochastic Oscillator

Arief Makmur 15:51 2025-04-23 UTC+2

Análise técnica do movimento intradiário de preços do GBP/CHF, terça-feira, 22 de abril de 2025

Ao analisarmos o gráfico de 4 horas do par cruzado GBP/CHF, observamos diversos elementos interessantes. Primeiramente, o surgimento de um padrão de triângulo, aliado ao movimento

Arief Makmur 15:50 2025-04-22 UTC+2

Análise técnica do movimento intradiário de preços do AUD/CAD, terça-feira, 22 de abril de 2025

Com o par AUD/CAD se movendo acima da média móvel ponderada de 21 períodos (WMA 21), que apresenta inclinação positiva, e com a ocorrência de convergência entre o movimento

Arief Makmur 15:47 2025-04-22 UTC+2

Análise técnica do movimento intradiário de preços do EUR/GBP, segunda-feira, 21 de abril de 2025

Com base no gráfico de 4 horas, o par EUR/GBP parece estar se movendo acima da EMA (100), o que indica que os compradores dominam o par. Assim, no futuro

Arief Makmur 15:36 2025-04-21 UTC+2

Análise técnica do movimento intradiário do USD/JPY, segunda-feira, 21 de abril de 2025.

Com o surgimento da convergência entre o movimento de preço do principal par de moedas USD/JPY, o indicador Oscilador Estocástico e a posição da EMA (100), que está acima

Arief Makmur 15:31 2025-04-21 UTC+2

Análise técnica do movimento intradiário de preços do índice Nasdaq 100, quinta-feira, 17 de abril de 2025

Com base na análise do gráfico de 4 horas do índice Nasdaq 100, destacam-se três pontos principais: primeiro, o movimento dos preços ocorre abaixo da média móvel de 100 períodos

Arief Makmur 15:16 2025-04-17 UTC+2

Previsão para o EUR/USD para 17 de abril de 2025

Na quarta-feira, o euro novamente entrou na faixa-alvo de 1,1385-1,1420. No entanto, o comportamento recente dos preços sugere que o nível de 1,1385 agora se tornou irrelevante – estamos observando

Laurie Bailey 14:58 2025-04-17 UTC+2

Previsão para o GBP/USD para 17 de abril de 2025

Ontem, o Reino Unido divulgou os dados de inflação de março. O IPC básico caiu de 3,0% ao ano para 2,8% ao ano, enquanto o IPC geral diminuiu de 2,8%

Laurie Bailey 14:54 2025-04-17 UTC+2

Previsão para o USD/CAD para 17 de abril de 2025

No gráfico diário, o oscilador Marlin aponta para uma possível reversão de alta. Abaixo, permanecem como referências o nível-alvo de 1,3746 e o limite inferior do canal de preços

Laurie Bailey 14:50 2025-04-17 UTC+2
Não pode falar agora?
Faça sua pergunta no chat.
 

Dear visitor,

Your IP address shows that you are currently located in the USA. If you are a resident of the United States, you are prohibited from using the services of InstaFintech Group including online trading, online transfers, deposit/withdrawal of funds, etc.

If you think you are seeing this message by mistake and your location is not the US, kindly proceed to the website. Otherwise, you must leave the website in order to comply with government restrictions.

Why does your IP address show your location as the USA?

  • - you are using a VPN provided by a hosting company based in the United States;
  • - your IP does not have proper WHOIS records;
  • - an error occurred in the WHOIS geolocation database.

Please confirm whether you are a US resident or not by clicking the relevant button below. If you choose the wrong option, being a US resident, you will not be able to open an account with InstaTrade anyway.

We are sorry for any inconvenience caused by this message.