Veja também


 30.11.2023 09:51 AM
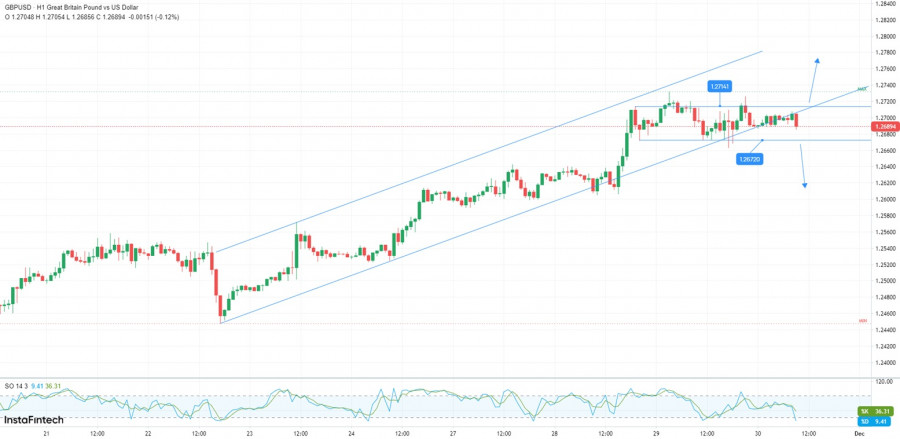
The currency pair is trading in the red at 1.2690 at the time of writing. It moves sideways in the short term, that's why we have to wait for new trading opportunities. Technically, the price action signaled exhausted buyers, but a new leg down needs strong confirmation.
Fundamentally, the USD's current growth is natural after the US Prelim GDP and Prelim GDP Price Index came in better than expected yesterday. Today, the US Unemployment Claims could be reported higher at 219K above 209K in the previous reporting period, Core PCE Price Index should report a 0.2% growth, Chicago PMI could jump to 46.0 points, while Pending Home Sales is expected to report a 1.9% drop. Positive US data should boost the greenback which could dominate the currency market.
As you can see on the H1 chart, the rate is trapped between 1.2714 and 1.2672 levels. It has failed to take out the 1.2714 resistance indicating exhausted buyers.
Now, it has dropped below the uptrend line which represents a key dynamic support. The next downside obstacle is represented by 1.2672.
A bearish closure below 1.2672 activates more declines. This is seen as a selling signal.
You have already liked this post today
*A análise de mercado aqui postada destina-se a aumentar o seu conhecimento, mas não dar instruções para fazer uma negociação.
Com a presença de uma divergência entre o movimento de preços do par AUD/JPY e o indicador Stochastic Oscillator, além do preço estar acima da média móvel ponderada (WMA)
Ao observar o gráfico de 4 horas, o ouro ainda apresenta viés de alta. No entanto, a divergência entre o movimento de preços do ouro e o indicador Stochastic Oscillator
Ao analisarmos o gráfico de 4 horas do par cruzado GBP/CHF, observamos diversos elementos interessantes. Primeiramente, o surgimento de um padrão de triângulo, aliado ao movimento
Com o par AUD/CAD se movendo acima da média móvel ponderada de 21 períodos (WMA 21), que apresenta inclinação positiva, e com a ocorrência de convergência entre o movimento
Com o surgimento da convergência entre o movimento de preço do principal par de moedas USD/JPY, o indicador Oscilador Estocástico e a posição da EMA (100), que está acima
Com base na análise do gráfico de 4 horas do índice Nasdaq 100, destacam-se três pontos principais: primeiro, o movimento dos preços ocorre abaixo da média móvel de 100 períodos
Clube InstaForex

Your IP address shows that you are currently located in the USA. If you are a resident of the United States, you are prohibited from using the services of InstaFintech Group including online trading, online transfers, deposit/withdrawal of funds, etc.
If you think you are seeing this message by mistake and your location is not the US, kindly proceed to the website. Otherwise, you must leave the website in order to comply with government restrictions.
Why does your IP address show your location as the USA?
Please confirm whether you are a US resident or not by clicking the relevant button below. If you choose the wrong option, being a US resident, you will not be able to open an account with InstaTrade anyway.
We are sorry for any inconvenience caused by this message.

