Veja também

 23.10.2024 03:24 AM
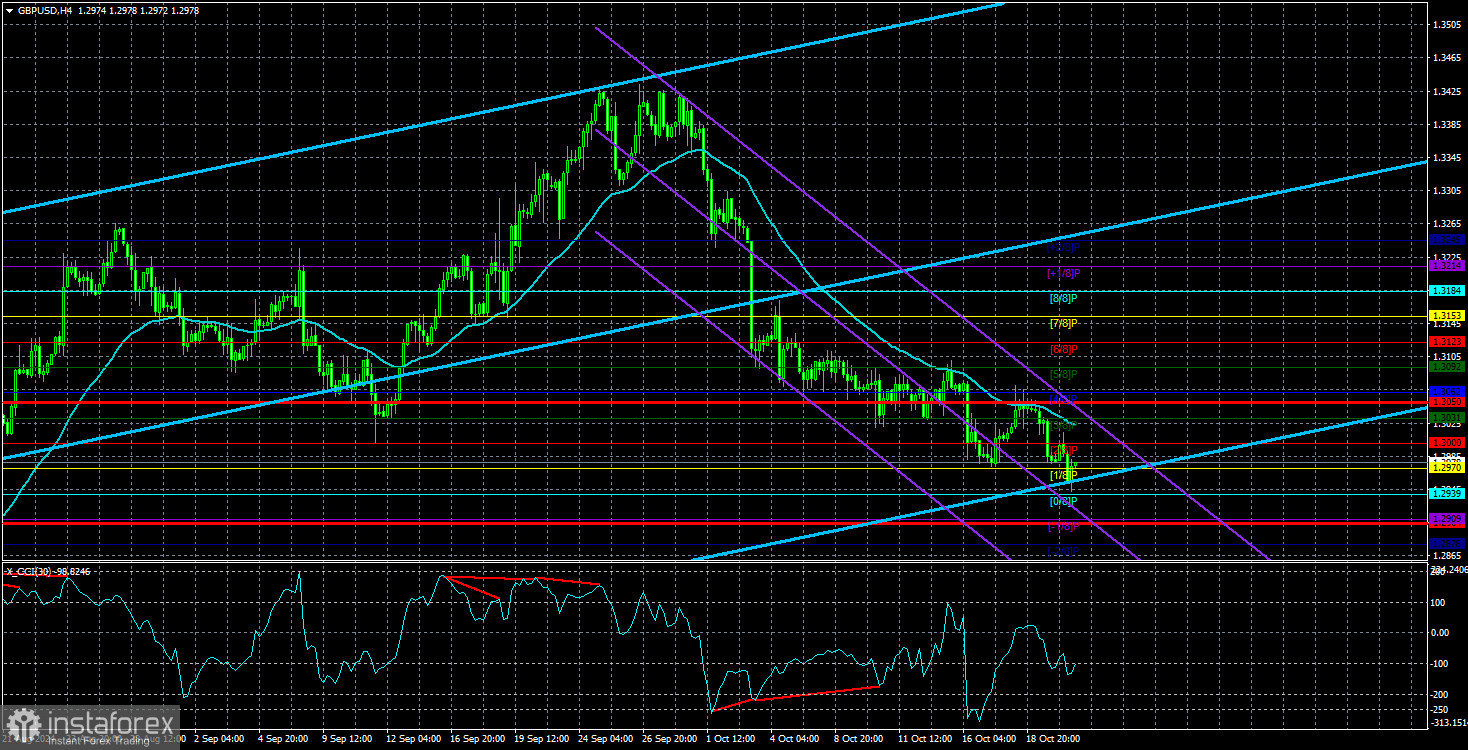
The GBP/USD currency pair continued to trade downward on Tuesday and, on its third attempt (as we anticipated), broke through the 1.3000 level. It's worth noting that this level is psychological, thus acting as resistance or support for market participants. However, the British pound only enjoyed this support for a short time. It only took a couple of days for this support to fail. As a result, the British pound is falling again, and this decline is fully justified. Over time, the situation for the pound hasn't changed at all. It remains overbought and unjustifiably expensive. The market has been factoring in the monetary policy easing almost since September 2022 while ignoring other factors. In September 2024, the Fed officially began easing its monetary policy, leaving no more factors for the dollar's decline. The recession in the US did not begin, and the market remembered that the Bank of England should also lower its rates...
Therefore, we believe that the British pound may continue to fall for a long time and in a tedious manner. At the moment, a target of 1.1855 seems minimal. Yes, this target might seem far-fetched now, but a few weeks ago, when the pound was near the 1.3400 level, few could have predicted a nearly 500-pip drop. We clearly remember that a month ago, many well-known analysts justified the British currency's new strengthening almost daily and predicted its further growth. The situation has changed, and nothing is surprising about that.
The problem with many experts is that they do not forecast but instead explain already occurring movements. Who benefits from this, and who might find this interesting? It's easy to say that the pound fell due to weak US data. Everyone is aware of these reports, and this conclusion is evident even for beginners. At the same time, few experts make forecasts supported by specific facts and reasoning.
For example, one of Commerzbank's analysts, Antje Praefcke, believes the US dollar is rising against the backdrop of a "rosy picture in the American economy." Frankly, it's challenging to comment on this view because the US dollar has been under pressure for the past six months due to weak labor market data and unemployment in the US. And now, it suddenly started rising on the same data. Or is it implied that the 500-pip rise is a reaction to the latest NonFarm Payrolls and unemployment rate reports? That seems like an overly strong reaction. Moreover, what "rosy picture" are we talking about when most experts have been predicting a recession for the American economy throughout 2024? But as soon as the dollar started rising, talks of a recession stopped, and a "rosy" picture emerged.
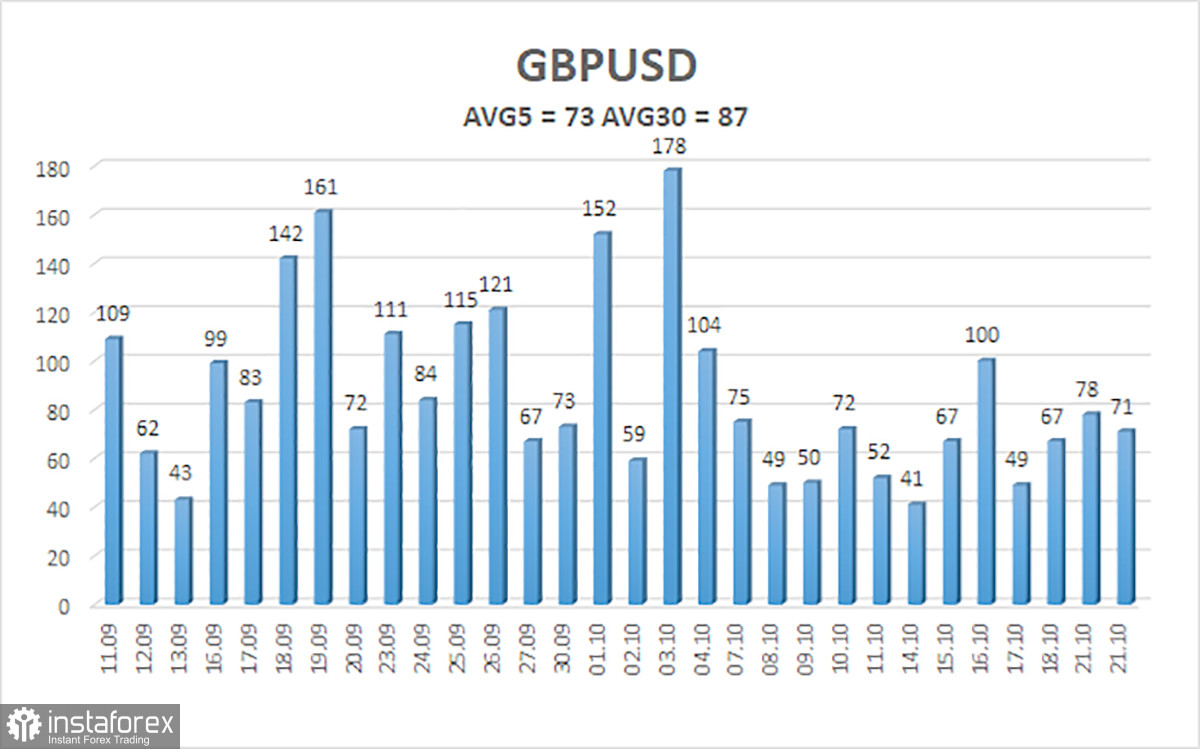
The average volatility of the GBP/USD pair over the last five trading days is 73 pips. For the pound/dollar pair, this value is considered "average." Thus, on Wednesday, October 23, we expect movement from 1.2904 to 1.3050. The higher linear regression channel is directed upwards, indicating the continuation of an upward trend. The CCI indicator formed six bearish divergences before the decline began. Recently, the indicator entered the oversold area and formed several bullish divergences—a potential upward correction is on the horizon.
Nearest Support Levels:
Nearest Resistance Levels:
The GBP/USD currency pair maintains its downward trend. We still do not consider long positions, as we believe that all growth factors for the British currency have already been priced in by the market several times over. If you trade using "pure technicals," long positions are possible with targets of 1.3092 and 1.3123 if the price is above the moving average line. Short positions are much more relevant now, with targets of 1.2939 and 1.2909. However, consolidation above the moving average would likely indicate a correction, which could take considerable time.
Linear Regression Channels: help determine the current trend. If both are directed the same way, the trend is strong.
Moving Average Line (settings 20,0, smoothed): defines the short-term trend and the direction in which trading should be conducted.
Murray Levels: target levels for movements and corrections.
Volatility Levels (red lines): the likely price range the pair will trade in the next 24 hours, based on current volatility readings.
CCI Indicator: entering the oversold area (below -250) or the overbought area (above +250) signals that a trend reversal in the opposite direction is near.
You have already liked this post today
*A análise de mercado aqui postada destina-se a aumentar o seu conhecimento, mas não dar instruções para fazer uma negociação.


