Актуальные паттерны

Паттерны – это графические модели, которые "рисует" цена на графике. Один из постулатов технического анализа говорит нам о том, что история (движение цены) всегда повторяется. Это значит, что в похожих ситуациях движение цены, зачастую, будет похожим, что позволяет с высокой долей вероятности спрогнозировать дальнейшее развитие ситуации.
Актуальные паттерны от ИнстаФорекс – это удобный сервис, который позволит вам всегда быть в курсе последних изменений на рынке и вовремя реагировать на появившиеся подсказки от рынка. В нашем сервисе вы всегда найдете самые свежие и актуальные паттерны на любой паре и на любом таймфрейме.
Медвежий симметричный треугольник
сформирован 03.04 в 03:22:08 (UTC+0)
сила сигнала 1 из 5
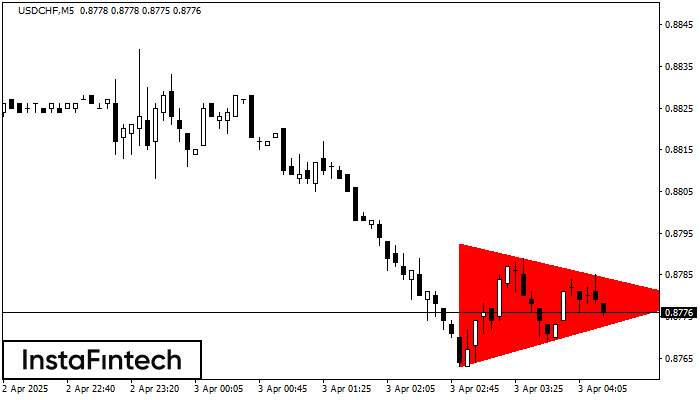
По USDCHF M5 сформировалась фигура «Медвежий симметричный треугольник». Данная фигура сигнализирует нам о продолжении нисходящего тренда в случае пробоя нижней границы 0.8763, где вероятная прибыль будет являться шириной текущей фигуры -30 пунктов.
Таймфреймы М5 и М15 могут иметь больше ложных точек входа.
Смотрите также
- Все
- Все
- Bearish Rectangle
- Bearish Symmetrical Triangle
- Bearish Symmetrical Triangle
- Bullish Rectangle
- Double Top
- Double Top
- Triple Bottom
- Triple Bottom
- Triple Top
- Triple Top
- Все
- Все
- Покупка
- Продажа
- Все
- 1
- 2
- 3
- 4
- 5
Bearish Flag
was formed on 11.04 at 08:37:39 (UTC+0)
signal strength 1 of 5
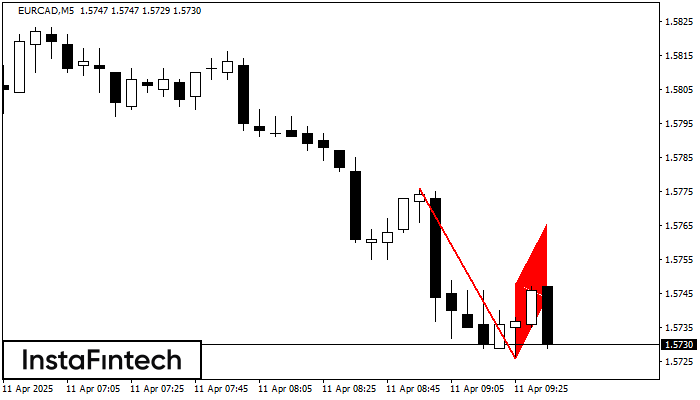
The Bearish Flag pattern has been formed on the chart EURCAD M5 which signals that the downward trend will continue. If the price breaks below the low at 1.5726, then
The M5 and M15 time frames may have more false entry points.
Open chart in a new window
Bearish pennant
was formed on 11.04 at 08:37:33 (UTC+0)
signal strength 1 of 5
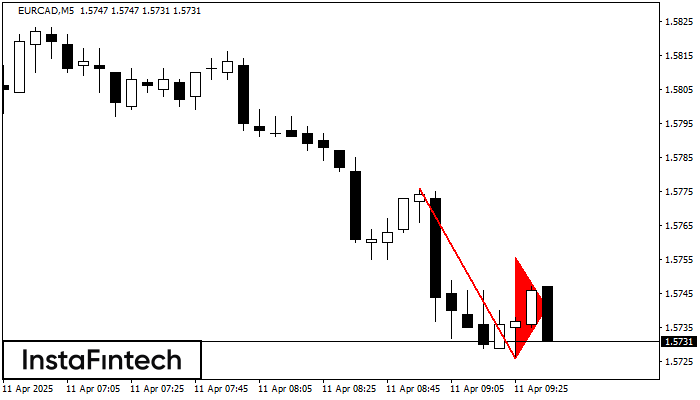
The Bearish pennant pattern has formed on the EURCAD M5 chart. This pattern type is characterized by a slight slowdown after which the price will move in the direction
The M5 and M15 time frames may have more false entry points.
Open chart in a new window
Inverse Head and Shoulder
was formed on 11.04 at 08:30:14 (UTC+0)
signal strength 3 of 5
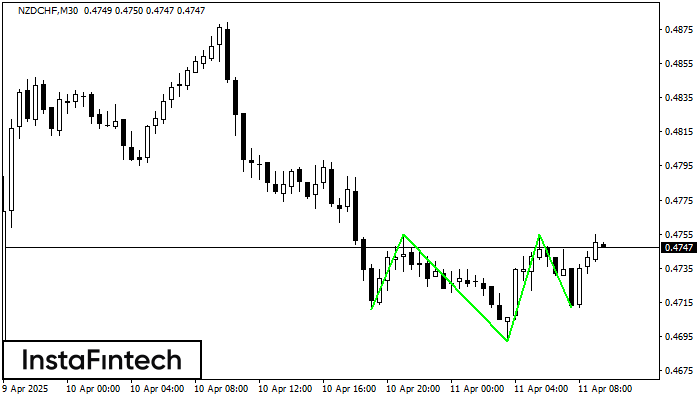
According to M30, NZDCHF is shaping the technical pattern – the Inverse Head and Shoulder. In case the Neckline 0.4755/0.4755 is broken out, the instrument is likely to move toward
Open chart in a new window