Vea también


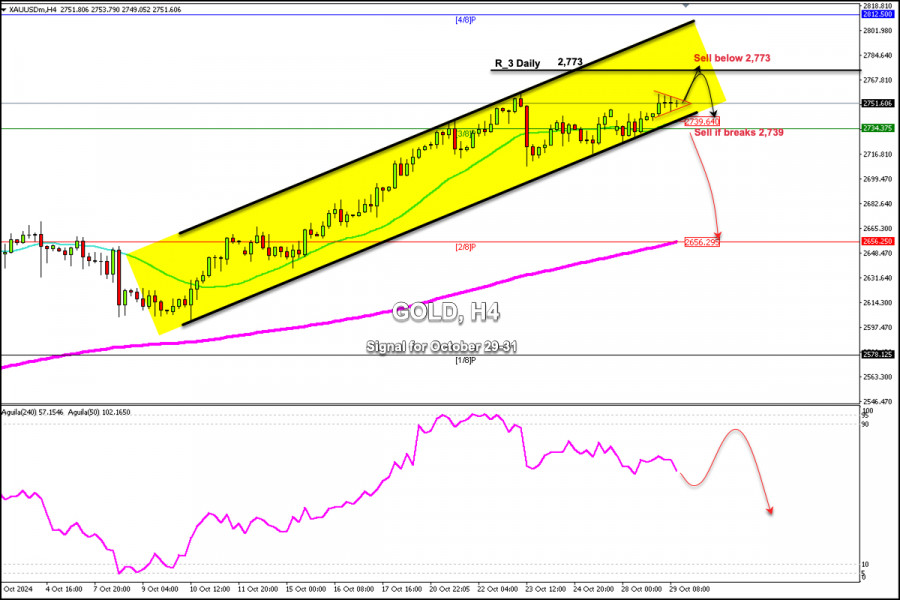
Early in the American session, gold is trading around 2,751 forming a symmetrical triangle pattern after having covered the gap left at 2,747.
Gold looks bullish and could continue its rise in the next few hours if it breaks above the symmetrical triangle. The metal could reach the daily R_3 of around 2,773.
On the contrary, if the gold price breaks below the symmetrical triangle, we could expect a breakout of the bullish trend channel and consolidation below the 21 SMA. Then, we could sell with targets at the 200 EMA around 2656.
Since October 20, the Eagle indicator has been giving a negative signal. So, any technical rebound can be seen as a signal to continue selling gold.
Therefore, if the gold price reaches the R_2 or R_3 resistance around 2,760 or 2,773, it will be seen as an opportunity to sell.
You have already liked this post today
*El análisis de mercado publicado aquí tiene la finalidad de incrementar su conocimiento, más no darle instrucciones para realizar una operación.


