Vea también

 24.10.2024 09:24 AM
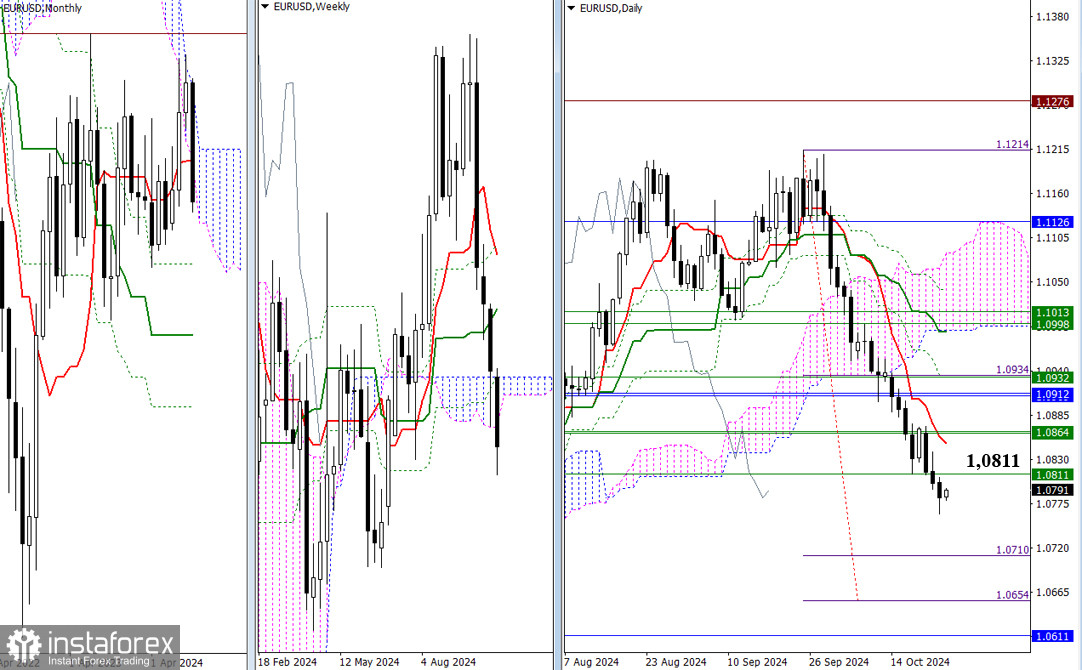
Higher Time Frames
Bearish players continue to operate below the weekly Ichimoku cloud (1.0811), extending the downtrend. The following bearish targets in this chart section are the daily cloud breakout target (1.0710 – 1.0654) and the monthly support level (1.0611). Bullish players need to rise and consolidate above the weekly cloud (1.0811 – 1.0864) to gain new opportunities and prospects in the current situation, with support from the daily short-term trend (1.0850).
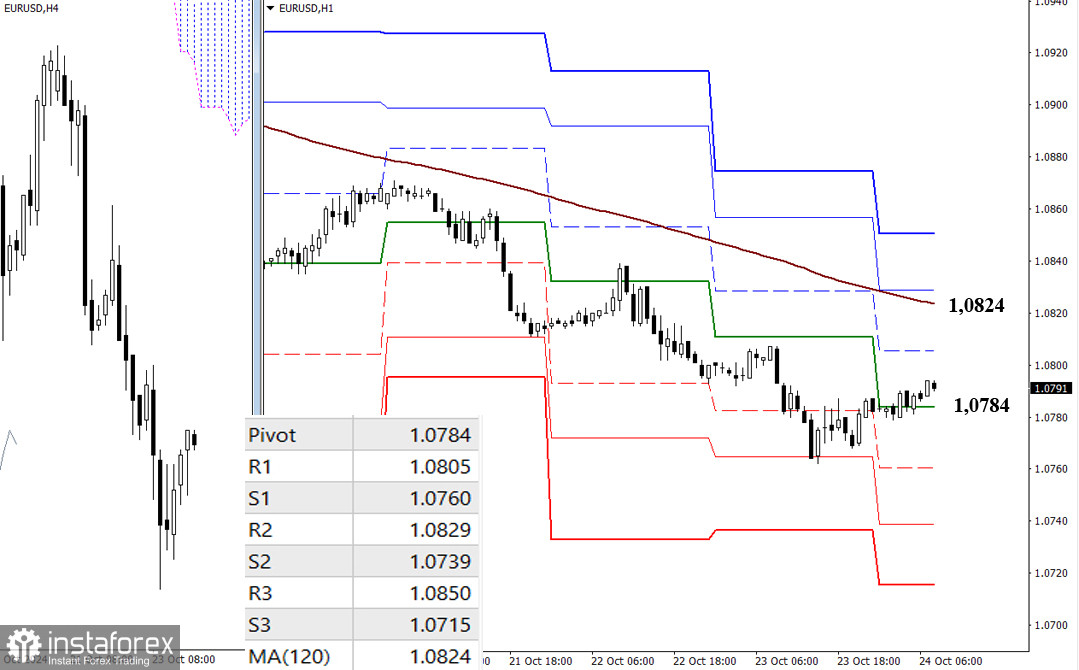
H4 – H1
The bears continue to have the main advantage in the lower time frames. After another downward phase, the pair is working within a corrective zone. The most critical level for the corrective movement is the weekly long-term trend (1.0824). Those who control the trend and its slope maintain the main advantage. The classic Pivot levels provide additional intraday targets for directional movement. Bearish players are focusing on supports, which today can be noted at 1.0760 – 1.0739 – 1.0715, while the areas of interest for bullish players include resistance levels of the classic Pivot points, currently at 1.0805 – 1.0829 – 1.0850.
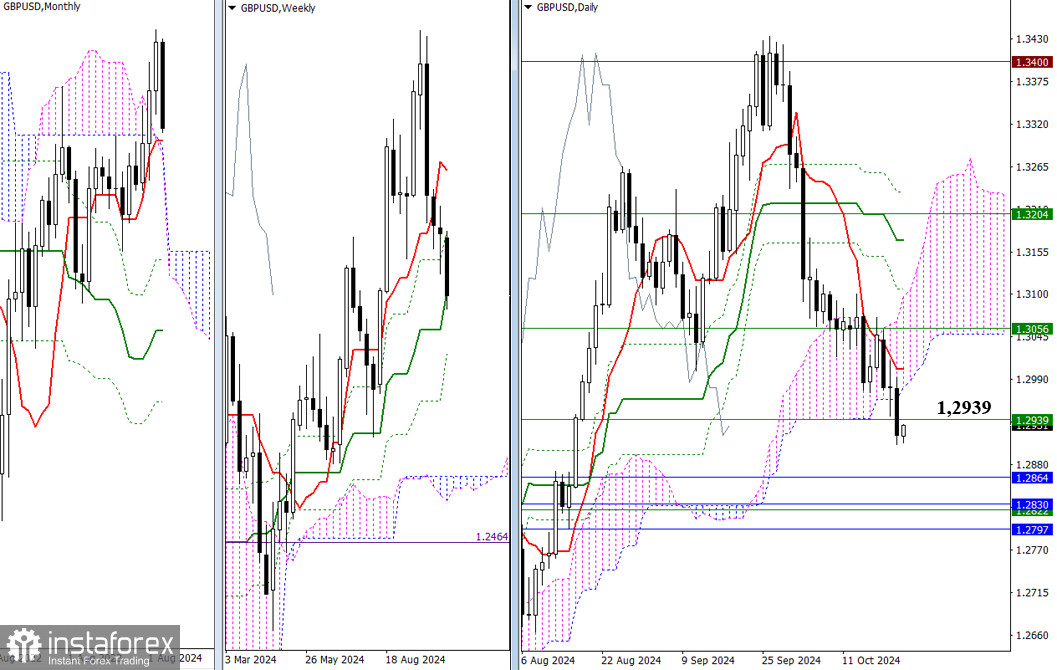
Higher Time Frames
Yesterday, bearish players left the daily Ichimoku cloud (1.2965) and secured a position below the weekly medium-term trend (1.2939). These levels and the daily short-term trend (1.3003) are currently the nearest targets for bullish players, should they decide to regain their positions and take the initiative. Meanwhile, for the development of the decline and the strengthening of bearish sentiment, the first area of support is at 1.2797 – 1.2864, encompassing the monthly cloud, monthly short-term trend, and the final level of the weekly golden cross of the Ichimoku.
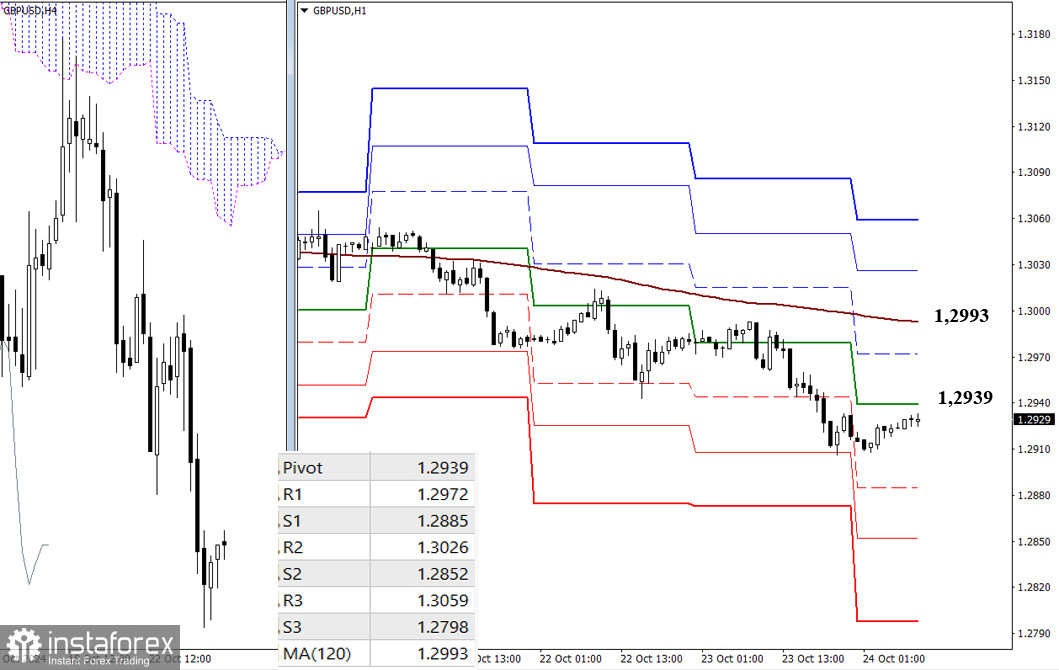
H4 – H1
At the end of yesterday, another phase of decline occurred, and now we see a slow movement within the corrective zone. The main advantage in the lower time frames remains with the bearish players. The main corrective boundaries are the key levels of the lower time frames; now, they can be noted at 1.2939 (central Pivot level of the day) and 1.2993 (weekly long-term trend). A breakout and reversal of the trend could serve as a basis for a shift in the current balance of power. For intraday bullish players, resistance levels from the classic Pivot points can be used as targets today at 1.2972 – 1.3026 – 1.3059. If the current correction ends and the bears resume their downward trend, their attention will focus on breaking through the support levels of the classic Pivot points (1.2885 – 1.2852 – 1.2798).
Technical Analysis Tools Used:
Higher time frames: Ichimoku Kinko Hyo (9.26.52) + Fibonacci Kijun levels;
Lower time frames: H1 – Pivot Points (classic) + 120-period Moving Average (weekly long-term trend).
You have already liked this post today
*El análisis de mercado publicado aquí tiene la finalidad de incrementar su conocimiento, más no darle instrucciones para realizar una operación.


