Vea también

 25.10.2024 03:36 AM
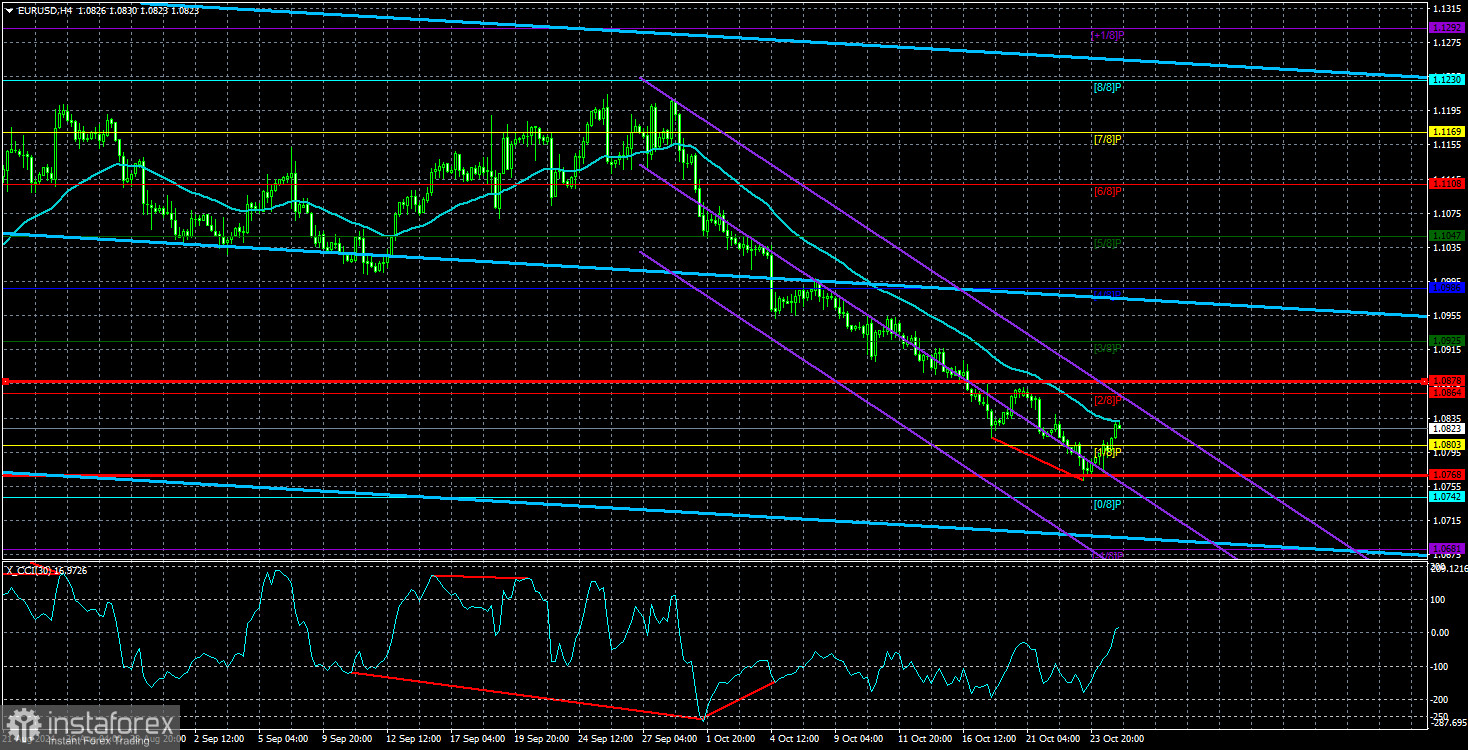
The EUR/USD currency pair failed to show growth on Thursday. Since early in the night, quotes seemed to be preparing for an upward move that day, but ultimately, nothing materialized. In the morning, the Eurozone released business activity indices for the manufacturing and services sectors, which were worse than expected, reaffirming that the Eurozone economy is not in its best shape. However, this was evident even without the business activity indices. The Eurozone's GDP has barely grown over the past two years, so there's no question whether the EU's economy is facing challenges.
The European Central Bank (ECB) has also started to pay attention to this issue. Interestingly, no one mentioned the slow economic growth in the Eurozone for two years, but in the past couple of months, officials and analysts have begun to note that the EU economy is hardly growing. This has sparked discussions about accelerating the pace of the ECB's monetary policy, easing faster than once every two meetings and consistently putting pressure on the euro. However, the Federal Reserve's monetary policy remains the main driver behind the decline of the EUR/USD pair. The fact that the market has fully priced in the Fed's easing over the last two years now supports the US dollar, as all anticipated rate cuts have already been accounted for. Thus, the market can now only focus on the ECB's rate cuts while locking in profits from selling the dollar, which triggers a renewed strengthening of the US currency.
There's not much more to add about the current situation. We have warned that the euro's rise was entirely illogical for months. We mentioned that the ECB would also need to lower its rate to a "neutral" level. In October, the ECB might lower the key rate below the "neutral" level because economic growth is too weak, and inflation has already dropped below the target level. Hence, discussions are now about reducing rates below 2-2.5%. This is yet another bearish factor for the euro.
From a technical perspective, there is no reason to expect a correction to end soon. The price remains below the moving average line, so the decline in the quote should continue. Of course, the current movement will end sooner or later, and an upward correction will begin. However, we have a year-and-a-half-long flat on the daily chart, with a downward trend on the weekly chart. Thus, we can only expect a decline in the medium term. What will happen if Donald Trump or Kamala Harris takes office is not worth speculating on now. It certainly makes no sense to guess how the dollar might react to the US presidential election results.
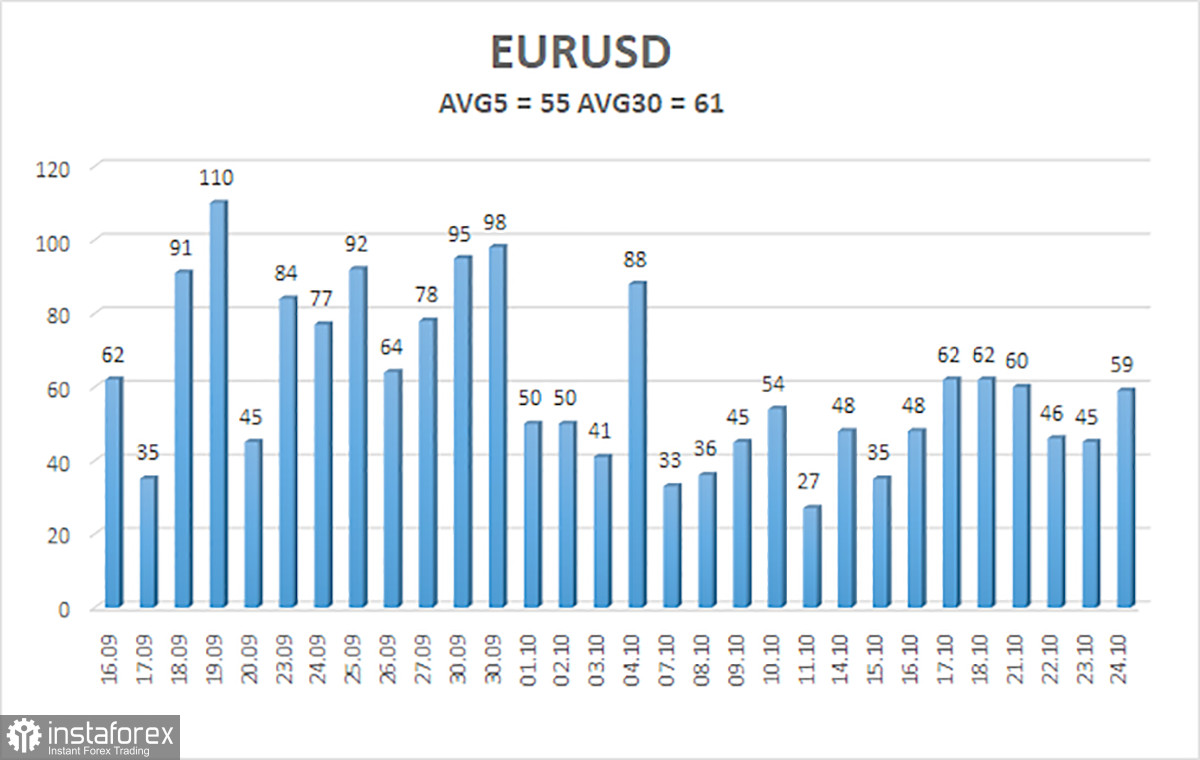
The average volatility of the EUR/USD currency pair over the last five trading days as of October 25 is 55 pips, characterized as "low." We expect the pair to move between the levels of 1.0768 and 1.0878 on Friday. The higher linear regression channel points upward, but the overall downward trend remains intact. After a series of moves into the overbought area, the CCI indicator has reached the oversold area and formed several bullish divergences, indicating a possible correction.
Closest support levels:
Closest resistance levels:
The EUR/USD pair continues its downward movement. In recent weeks, we have consistently stated that we expect the euro to continue falling in the medium term, and we fully support the bearish trend direction. There is a chance that the market has already priced in all or almost all future Fed rate cuts. If that's the case, the dollar has no further reasons to fall, although there were few. Short positions can still be considered with targets at 1.0768 and 1.0742 if the price remains below the moving average. If you trade based on "pure" technical analysis, long positions will become relevant if the price consolidates above the moving average line. However, such consolidation in the near term would likely indicate only a correction.
Linear Regression Channels: help determine the current trend. If both are directed the same way, the trend is strong.
Moving Average Line (settings 20,0, smoothed): defines the short-term trend and the direction in which trading should be conducted.
Murray Levels: target levels for movements and corrections.
Volatility Levels (red lines): the likely price range the pair will trade in the next 24 hours, based on current volatility readings.
CCI Indicator: entering the oversold area (below -250) or the overbought area (above +250) signals that a trend reversal in the opposite direction is near.
You have already liked this post today
*El análisis de mercado publicado aquí tiene la finalidad de incrementar su conocimiento, más no darle instrucciones para realizar una operación.


