Patrones actuales

Los patrones son modelos gráficos que se forman en el gráfico mediante el precio. Según uno de los postulados del análisis técnico, la historia (movimiento del precio) se repite. Esto quiere decir que los movimientos del precio a menudo son similares en las mismas situaciones que hacen posible pronosticar el futuro desarrollo de la situación con una alta probabilidad.
Los patrones relevantes de InstaTrade son un servicio fácil de utilizar que permiten que conozca los últimos cambios en el mercado y reaccione a las pistas del mercado a tiempo. En nuestro servicio, siempre encontrará los últimos y más importantes patrones en cualquier par y en cualquier marco de tiempo.
Triple Bottom
was formed on 03.04 at 02:20:30 (UTC+0)
signal strength 1 of 5
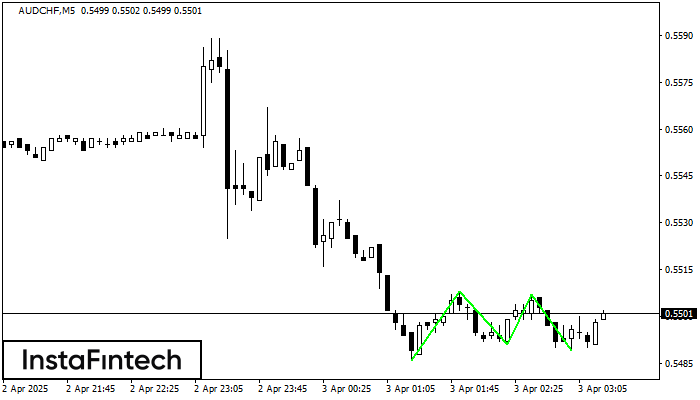
The Triple Bottom pattern has formed on the chart of the AUDCHF M5 trading instrument. The pattern signals a change in the trend from downwards to upwards in the case of breakdown of 0.5508/0.5507.
The M5 and M15 time frames may have more false entry points.
Vea asimismo
- All
- All
- Bearish Rectangle
- Bearish Symmetrical Triangle
- Bearish Symmetrical Triangle
- Bullish Rectangle
- Double Top
- Double Top
- Triple Bottom
- Triple Bottom
- Triple Top
- Triple Top
- All
- All
- Buy
- Sale
- All
- 1
- 2
- 3
- 4
- 5
Bearish Flag
was formed on 11.04 at 08:37:39 (UTC+0)
signal strength 1 of 5
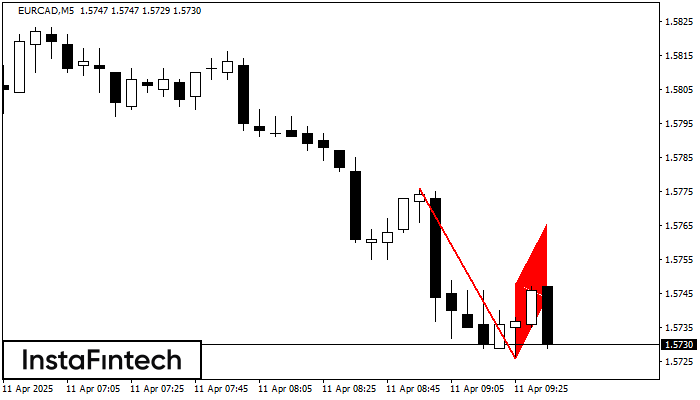
The Bearish Flag pattern has been formed on the chart EURCAD M5 which signals that the downward trend will continue. If the price breaks below the low at 1.5726, then
The M5 and M15 time frames may have more false entry points.
Open chart in a new window
Bearish pennant
was formed on 11.04 at 08:37:33 (UTC+0)
signal strength 1 of 5
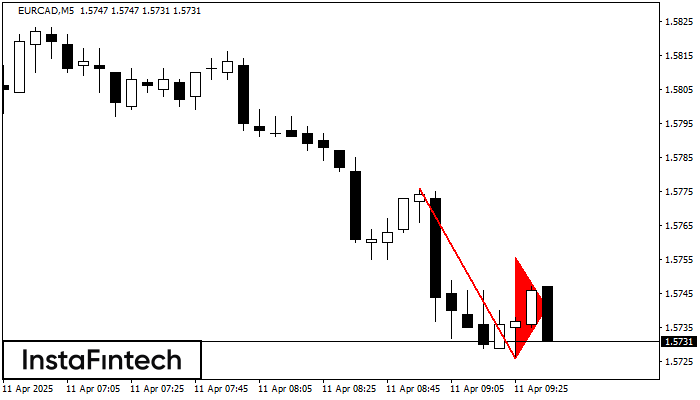
The Bearish pennant pattern has formed on the EURCAD M5 chart. This pattern type is characterized by a slight slowdown after which the price will move in the direction
The M5 and M15 time frames may have more false entry points.
Open chart in a new window
Inverse Head and Shoulder
was formed on 11.04 at 08:30:14 (UTC+0)
signal strength 3 of 5
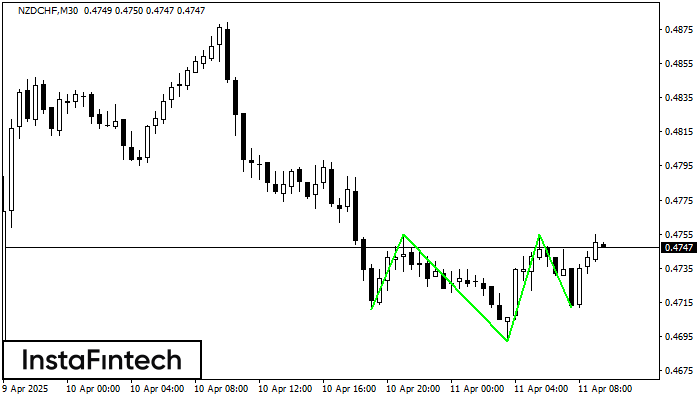
According to M30, NZDCHF is shaping the technical pattern – the Inverse Head and Shoulder. In case the Neckline 0.4755/0.4755 is broken out, the instrument is likely to move toward
Open chart in a new window