รูปแบบกราฟ

รูปแบบกราฟนั้นเป็น รูปจำลองทางกราฟฟิกที่ถูกสร้างขึ้นมาในชาร์ตจากราคา อ้างอิงตามหนึ่งในการวิเคราะห์ทางเทคนิค ที่ตั้งสมมติฐานมาว่า ประวัติศาสตร์ (การเคลื่อนไหวของราคา) มักจะเกิดขึ้นซ้ำรอยเดิม นั้นหมายความว่า การเคลื่อนไหวของราคาก็หมือนกับ สถานการณ์หนึ่งที่จะสามารถทำการคาดการณ์ไปยังทิศทางในอนาคต ตามเหตุการณ์ที่น่าจะมีความเป็นไปได้สูง
รูปแบบกราฟที่สำคัญจากทาง InstaTrade นั้นจะเป็นการบริการที่มีการใช้อย่างง่ายดาย ซึ่งจะช่วยให้คุณสามารถทราบถึงการเปลี่ยนแปลงล่าสุด ในตลาดได้ และสามารถรับมือกับข้อมูลจากทางตลาดได้ทันท่วงที ในการบริการของพวกเรานั้น คุณจะพบกับรูปแบบกราฟล่าสุดและมีความสำคัญมากที่สุดในทุกๆคู่สกุลเงิน และทุกๆขอบเขตเวลา
Triple Bottom
was formed on 30.01 at 18:25:17 (UTC+0)
signal strength 1 of 5
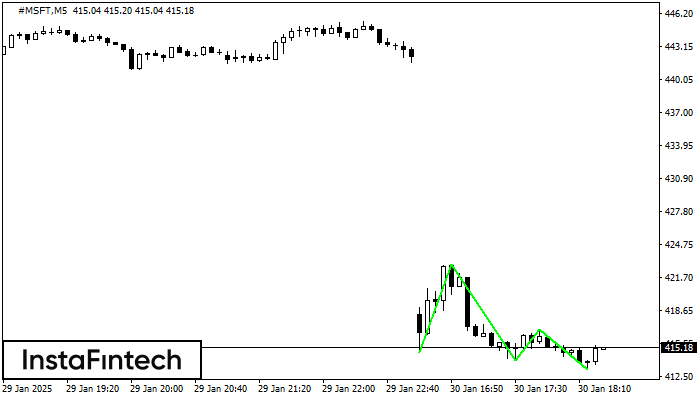
The Triple Bottom pattern has formed on the chart of #MSFT M5. Features of the pattern: The lower line of the pattern has coordinates 422.89 with the upper limit 422.89/416.92, the projection of the width is 814 points. The formation of the Triple Bottom pattern most likely indicates a change in the trend from downward to upward. This means that in the event of a breakdown of the resistance level 414.75, the price is most likely to continue the upward movement.
The M5 and M15 time frames may have more false entry points.
ดูเพิ่มเติม
- All
- All
- Bearish Rectangle
- Bearish Symmetrical Triangle
- Bearish Symmetrical Triangle
- Bullish Rectangle
- Double Top
- Double Top
- Triple Bottom
- Triple Bottom
- Triple Top
- Triple Top
- All
- All
- Buy
- Sale
- All
- 1
- 2
- 3
- 4
- 5
Double Bottom
сформирован 21.02 в 23:45:53 (UTC+0)
сила сигнала 2 из 5
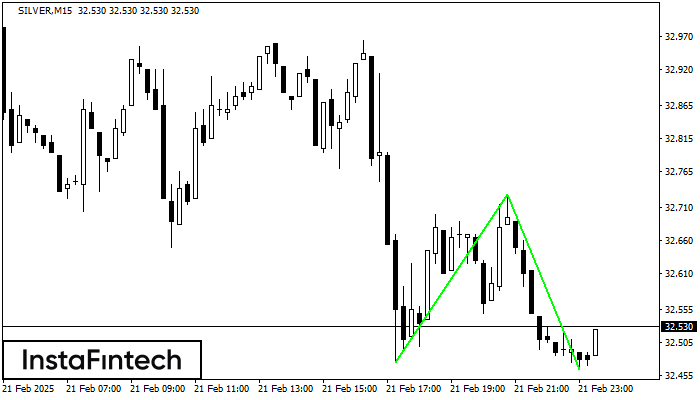
The Double Bottom pattern has been formed on SILVER M15; the upper boundary is 32.73; the lower boundary is 32.47. The width of the pattern is 255 points. In case
The M5 and M15 time frames may have more false entry points.
Открыть график инструмента в новом окне
Triple Bottom
сформирован 21.02 в 23:45:40 (UTC+0)
сила сигнала 1 из 5
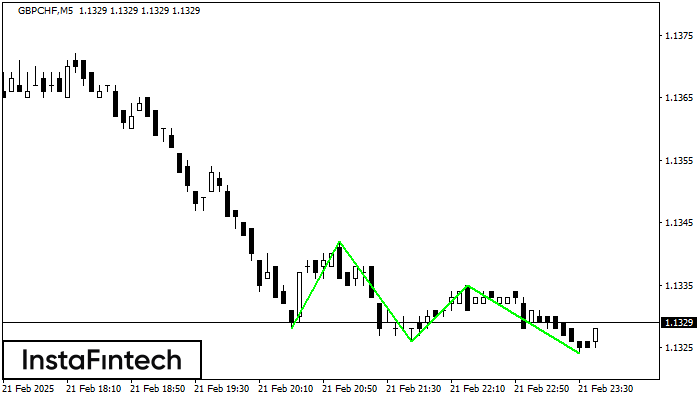
The Triple Bottom pattern has been formed on GBPCHF M5. It has the following characteristics: resistance level 1.1342/1.1335; support level 1.1328/1.1324; the width is 14 points. In the event
The M5 and M15 time frames may have more false entry points.
Открыть график инструмента в новом окне
Bearish pennant
сформирован 21.02 в 23:06:21 (UTC+0)
сила сигнала 3 из 5
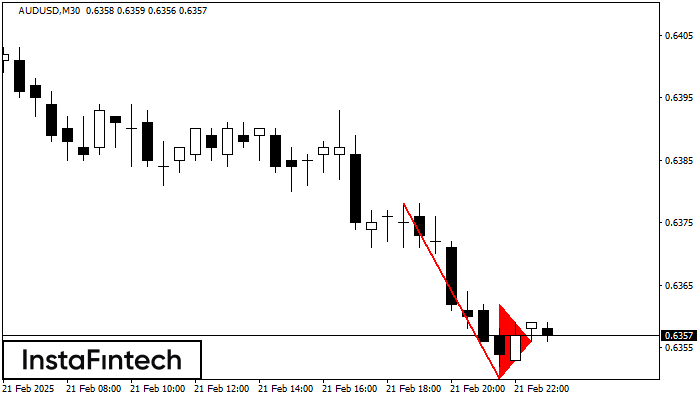
The Bearish pennant pattern has formed on the AUDUSD M30 chart. It signals potential continuation of the existing trend. Specifications: the pattern’s bottom has the coordinate of 0.6350; the projection
Открыть график инструмента в новом окне
Double Bottom
сформирован 21.02 в 22:55:23 (UTC+0)
сила сигнала 1 из 5
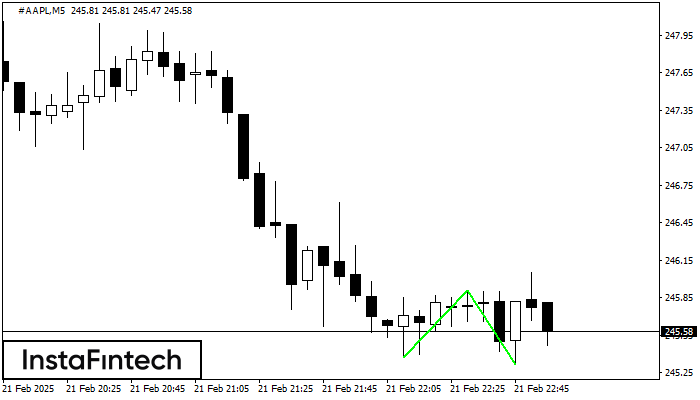
The Double Bottom pattern has been formed on #AAPL M5. This formation signals a reversal of the trend from downwards to upwards. The signal is that a buy trade should
The M5 and M15 time frames may have more false entry points.
Открыть график инструмента в новом окне
Double Bottom
сформирован 21.02 в 22:55:20 (UTC+0)
сила сигнала 1 из 5
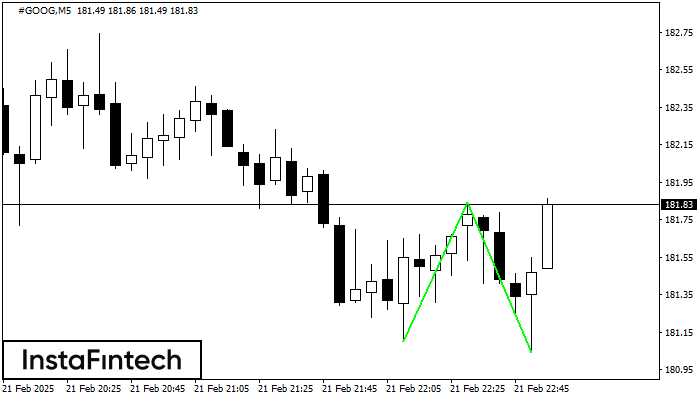
The Double Bottom pattern has been formed on #GOOG M5. Characteristics: the support level 181.10; the resistance level 181.84; the width of the pattern 74 points. If the resistance level
The M5 and M15 time frames may have more false entry points.
Открыть график инструмента в новом окне
Double Bottom
сформирован 21.02 в 22:45:26 (UTC+0)
сила сигнала 1 из 5
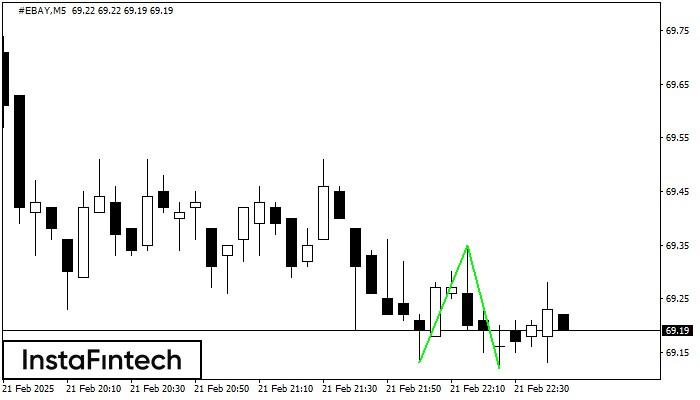
The Double Bottom pattern has been formed on #EBAY M5. Characteristics: the support level 69.13; the resistance level 69.35; the width of the pattern 22 points. If the resistance level
The M5 and M15 time frames may have more false entry points.
Открыть график инструмента в новом окне
Triple Bottom
сформирован 21.02 в 22:40:07 (UTC+0)
сила сигнала 1 из 5
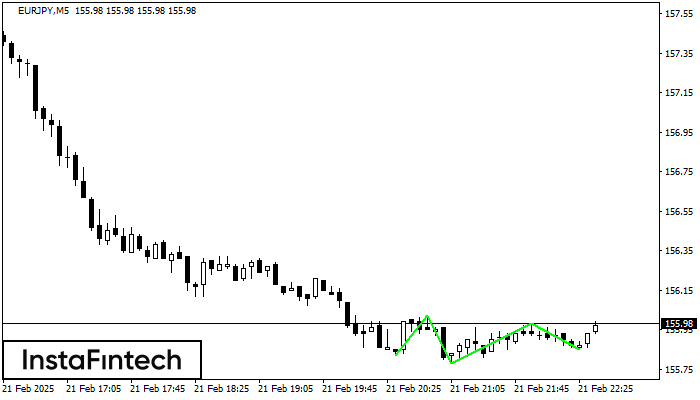
The Triple Bottom pattern has formed on the chart of EURJPY M5. Features of the pattern: The lower line of the pattern has coordinates 156.02 with the upper limit 156.02/155.98
The M5 and M15 time frames may have more false entry points.
Открыть график инструмента в новом окне
Triple Bottom
сформирован 21.02 в 22:35:02 (UTC+0)
сила сигнала 1 из 5
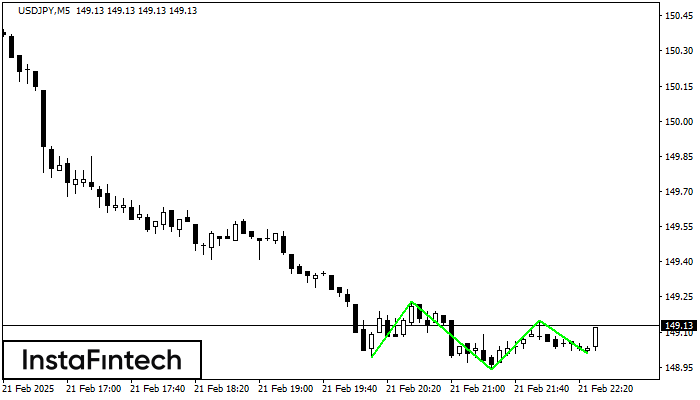
The Triple Bottom pattern has been formed on USDJPY M5. It has the following characteristics: resistance level 149.23/149.15; support level 148.99/149.01; the width is 24 points. In the event
The M5 and M15 time frames may have more false entry points.
Открыть график инструмента в новом окне
Bearish Symmetrical Triangle
сформирован 21.02 в 22:26:42 (UTC+0)
сила сигнала 2 из 5
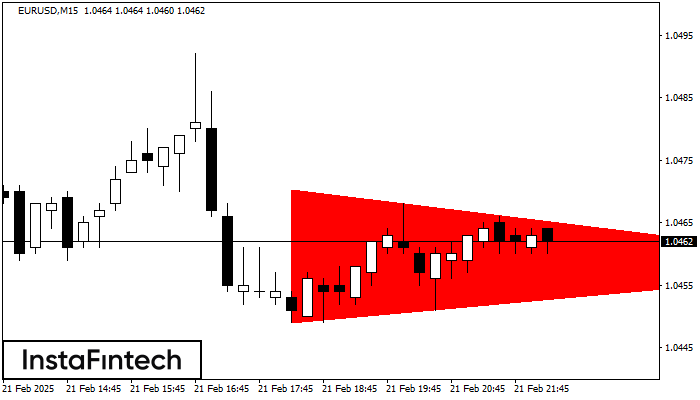
According to the chart of M15, EURUSD formed the Bearish Symmetrical Triangle pattern. Trading recommendations: A breach of the lower border 1.0449 is likely to encourage a continuation
The M5 and M15 time frames may have more false entry points.
Открыть график инструмента в новом окне