รูปแบบกราฟ

รูปแบบกราฟนั้นเป็น รูปจำลองทางกราฟฟิกที่ถูกสร้างขึ้นมาในชาร์ตจากราคา อ้างอิงตามหนึ่งในการวิเคราะห์ทางเทคนิค ที่ตั้งสมมติฐานมาว่า ประวัติศาสตร์ (การเคลื่อนไหวของราคา) มักจะเกิดขึ้นซ้ำรอยเดิม นั้นหมายความว่า การเคลื่อนไหวของราคาก็หมือนกับ สถานการณ์หนึ่งที่จะสามารถทำการคาดการณ์ไปยังทิศทางในอนาคต ตามเหตุการณ์ที่น่าจะมีความเป็นไปได้สูง
รูปแบบกราฟที่สำคัญจากทาง InstaTrade นั้นจะเป็นการบริการที่มีการใช้อย่างง่ายดาย ซึ่งจะช่วยให้คุณสามารถทราบถึงการเปลี่ยนแปลงล่าสุด ในตลาดได้ และสามารถรับมือกับข้อมูลจากทางตลาดได้ทันท่วงที ในการบริการของพวกเรานั้น คุณจะพบกับรูปแบบกราฟล่าสุดและมีความสำคัญมากที่สุดในทุกๆคู่สกุลเงิน และทุกๆขอบเขตเวลา
Double Bottom
was formed on 30.01 at 20:15:45 (UTC+0)
signal strength 1 of 5
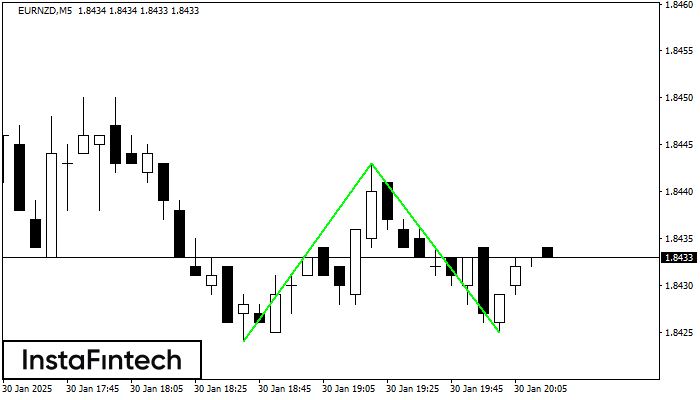
The Double Bottom pattern has been formed on EURNZD M5. Characteristics: the support level 1.8424; the resistance level 1.8443; the width of the pattern 19 points. If the resistance level is broken, a change in the trend can be predicted with the first target point lying at the distance of 18 points.
The M5 and M15 time frames may have more false entry points.
ดูเพิ่มเติม
- All
- All
- Bearish Rectangle
- Bearish Symmetrical Triangle
- Bearish Symmetrical Triangle
- Bullish Rectangle
- Double Top
- Double Top
- Triple Bottom
- Triple Bottom
- Triple Top
- Triple Top
- All
- All
- Buy
- Sale
- All
- 1
- 2
- 3
- 4
- 5
Double Bottom
was formed on 21.02 at 23:45:53 (UTC+0)
signal strength 2 of 5
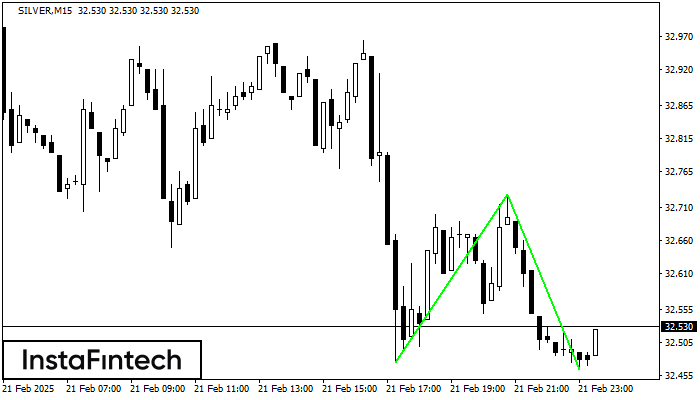
The Double Bottom pattern has been formed on SILVER M15; the upper boundary is 32.73; the lower boundary is 32.47. The width of the pattern is 255 points. In case
The M5 and M15 time frames may have more false entry points.
Open chart in a new window
Triple Bottom
was formed on 21.02 at 23:45:40 (UTC+0)
signal strength 1 of 5
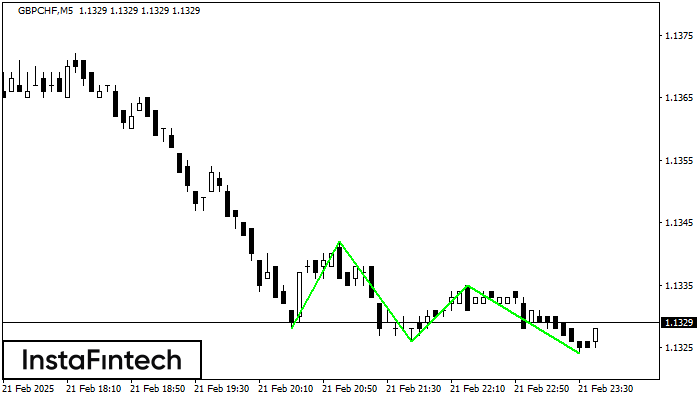
The Triple Bottom pattern has been formed on GBPCHF M5. It has the following characteristics: resistance level 1.1342/1.1335; support level 1.1328/1.1324; the width is 14 points. In the event
The M5 and M15 time frames may have more false entry points.
Open chart in a new window
Bearish pennant
was formed on 21.02 at 23:06:21 (UTC+0)
signal strength 3 of 5
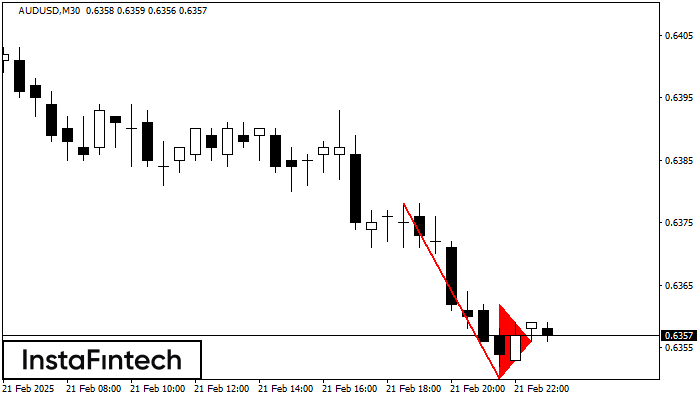
The Bearish pennant pattern has formed on the AUDUSD M30 chart. It signals potential continuation of the existing trend. Specifications: the pattern’s bottom has the coordinate of 0.6350; the projection
Open chart in a new window
Double Bottom
was formed on 21.02 at 22:55:23 (UTC+0)
signal strength 1 of 5
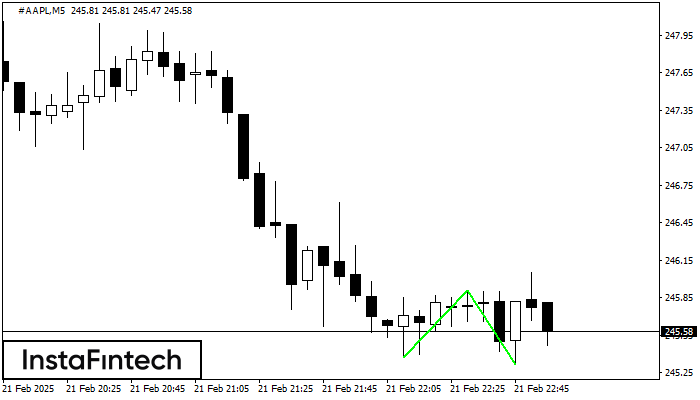
The Double Bottom pattern has been formed on #AAPL M5. This formation signals a reversal of the trend from downwards to upwards. The signal is that a buy trade should
The M5 and M15 time frames may have more false entry points.
Open chart in a new window
Double Bottom
was formed on 21.02 at 22:55:20 (UTC+0)
signal strength 1 of 5
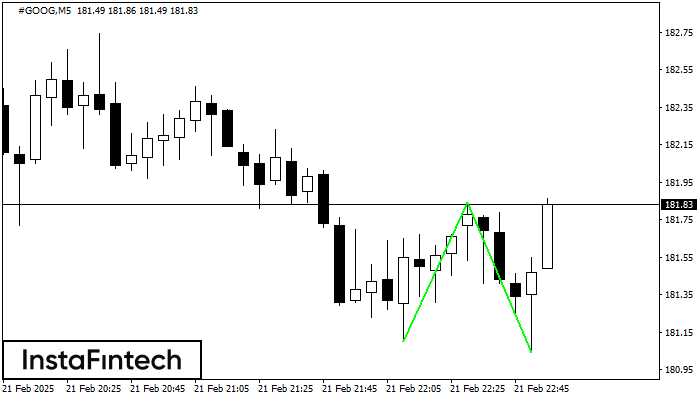
The Double Bottom pattern has been formed on #GOOG M5. Characteristics: the support level 181.10; the resistance level 181.84; the width of the pattern 74 points. If the resistance level
The M5 and M15 time frames may have more false entry points.
Open chart in a new window
Double Bottom
was formed on 21.02 at 22:45:26 (UTC+0)
signal strength 1 of 5
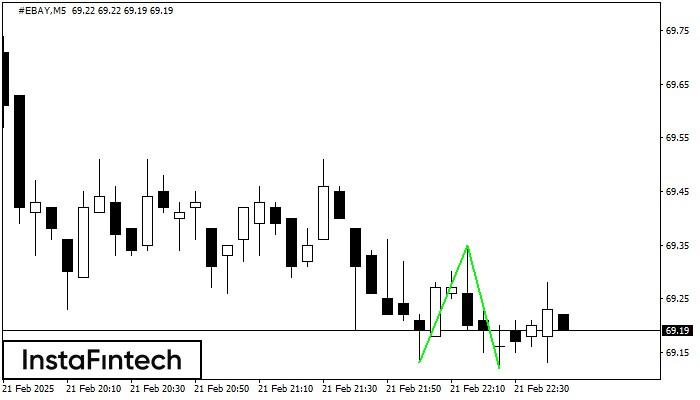
The Double Bottom pattern has been formed on #EBAY M5. Characteristics: the support level 69.13; the resistance level 69.35; the width of the pattern 22 points. If the resistance level
The M5 and M15 time frames may have more false entry points.
Open chart in a new window
Triple Bottom
was formed on 21.02 at 22:40:07 (UTC+0)
signal strength 1 of 5
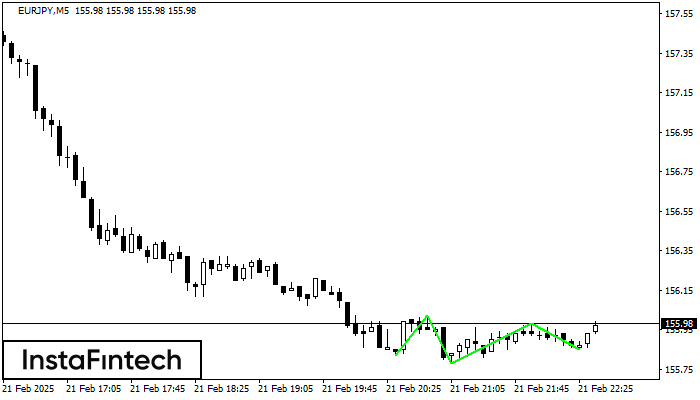
The Triple Bottom pattern has formed on the chart of EURJPY M5. Features of the pattern: The lower line of the pattern has coordinates 156.02 with the upper limit 156.02/155.98
The M5 and M15 time frames may have more false entry points.
Open chart in a new window
Triple Bottom
was formed on 21.02 at 22:35:02 (UTC+0)
signal strength 1 of 5
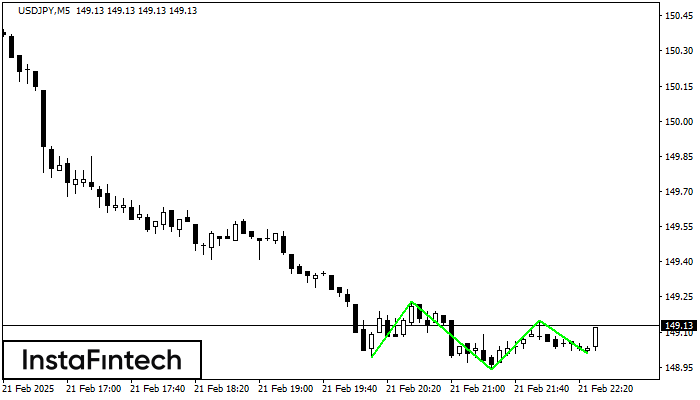
The Triple Bottom pattern has been formed on USDJPY M5. It has the following characteristics: resistance level 149.23/149.15; support level 148.99/149.01; the width is 24 points. In the event
The M5 and M15 time frames may have more false entry points.
Open chart in a new window
Bearish Symmetrical Triangle
was formed on 21.02 at 22:26:42 (UTC+0)
signal strength 2 of 5
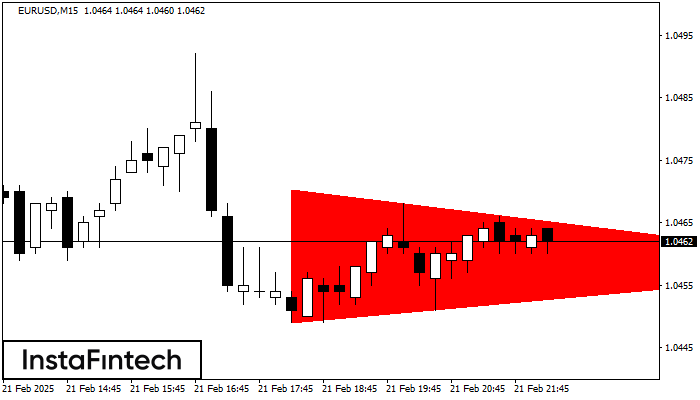
According to the chart of M15, EURUSD formed the Bearish Symmetrical Triangle pattern. Trading recommendations: A breach of the lower border 1.0449 is likely to encourage a continuation
The M5 and M15 time frames may have more false entry points.
Open chart in a new window