รูปแบบกราฟ

รูปแบบกราฟนั้นเป็น รูปจำลองทางกราฟฟิกที่ถูกสร้างขึ้นมาในชาร์ตจากราคา อ้างอิงตามหนึ่งในการวิเคราะห์ทางเทคนิค ที่ตั้งสมมติฐานมาว่า ประวัติศาสตร์ (การเคลื่อนไหวของราคา) มักจะเกิดขึ้นซ้ำรอยเดิม นั้นหมายความว่า การเคลื่อนไหวของราคาก็หมือนกับ สถานการณ์หนึ่งที่จะสามารถทำการคาดการณ์ไปยังทิศทางในอนาคต ตามเหตุการณ์ที่น่าจะมีความเป็นไปได้สูง
รูปแบบกราฟที่สำคัญจากทาง InstaTrade นั้นจะเป็นการบริการที่มีการใช้อย่างง่ายดาย ซึ่งจะช่วยให้คุณสามารถทราบถึงการเปลี่ยนแปลงล่าสุด ในตลาดได้ และสามารถรับมือกับข้อมูลจากทางตลาดได้ทันท่วงที ในการบริการของพวกเรานั้น คุณจะพบกับรูปแบบกราฟล่าสุดและมีความสำคัญมากที่สุดในทุกๆคู่สกุลเงิน และทุกๆขอบเขตเวลา
Bullish Symmetrical Triangle
was formed on 01.02 at 19:00:37 (UTC+0)
signal strength 1 of 5
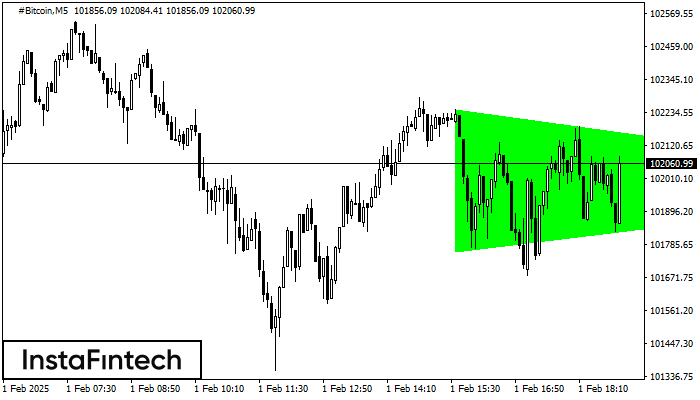
According to the chart of M5, #Bitcoin formed the Bullish Symmetrical Triangle pattern. The lower border of the pattern touches the coordinates 101762.12/101983.79 whereas the upper border goes across 102244.74/101983.79. If the Bullish Symmetrical Triangle pattern is in progress, this evidently signals a further upward trend. In other words, in case the scenario comes true, the price of #Bitcoin will breach the upper border to head for 101983.90.
The M5 and M15 time frames may have more false entry points.
ดูเพิ่มเติม
- All
- All
- Bearish Rectangle
- Bearish Symmetrical Triangle
- Bearish Symmetrical Triangle
- Bullish Rectangle
- Double Top
- Double Top
- Triple Bottom
- Triple Bottom
- Triple Top
- Triple Top
- All
- All
- Buy
- Sale
- All
- 1
- 2
- 3
- 4
- 5
รูปแบบกราฟจุดสองยอดขาลง (Double Bottom)
was formed on 08.03 at 00:35:13 (UTC+0)
signal strength 1 of 5

รูปแบบ รูปแบบกราฟจุดสองยอดขาลง (Double Bottom) ถูกสร้างขึ้นมาใน #Bitcoin M5 การก่อตัวเช่นนี้แสดงถึงการย้อนตัวของแนวโน้มจากด้านล่าง ขึ้นมายังด้านบน สัญญาณแสดงให้เห็นถึง การเทรดแบบการซื้อที่ควรเปิด หลังจากที่มีการเคลื่อนตัวทะลุผ่านขอบเขตด้านบนของรูปแบบ 87200.16 การเคลื่อนไหวต่อจากนั้นจะอยู่ในความกว้างของรูปแบบปัจจุบัน 164392
ขอบเตระยะเวลาใน M5 และ M15 อาจจะมีตำแหน่งการเข้าใช้งานที่ผิดพลาดมากยิ่งขึ้น
Open chart in a new window
รูปแบบสามเหลี่ยมสมมาตรขาลง (Bearish Symmetrical Triangle)
was formed on 07.03 at 23:53:36 (UTC+0)
signal strength 3 of 5

อ้างอิงจากชาร์ตของ M30, AUDUSD ที่ได้สร้างรูปแบบ รูปแบบสามเหลี่ยมสมมาตรขาลง (Bearish Symmetrical Triangle) ออกมา สำหรับคำแนะนำการซื้อขาย คือ การเคลื่อนตัวทะลุผ่านขอบเขตในด้านล่าง 0.6283 อาจจะช่วยสนับสนุนต่อแนวโน้มขาลงอย่างต่อเนื่อง
Open chart in a new window
รูปแบบสามเหลี่ยมสมมาตรขาลง (Bearish Symmetrical Triangle)
was formed on 07.03 at 23:32:27 (UTC+0)
signal strength 2 of 5

อ้างอิงจากชาร์ตของ M15, AUDUSD ที่ได้สร้างรูปแบบ รูปแบบสามเหลี่ยมสมมาตรขาลง (Bearish Symmetrical Triangle) ออกมา สำหรับคำแนะนำการซื้อขาย คือ การเคลื่อนตัวทะลุผ่านขอบเขตในด้านล่าง 0.6283 อาจจะช่วยสนับสนุนต่อแนวโน้มขาลงอย่างต่อเนื่อง
ขอบเตระยะเวลาใน M5 และ M15 อาจจะมีตำแหน่งการเข้าใช้งานที่ผิดพลาดมากยิ่งขึ้น
Open chart in a new window