Dolzarb patternlar

Двойное дно
сформирован 29.03 в 10:15:29 (UTC+0)
сила сигнала 1 из 5

Сформирована фигура «Двойное дно» на графике #Bitcoin M5. Характеристика: Уровень поддержки 83619.16; Уровень сопротивления 83858.95; Ширина фигуры 23979 пунктов. В случае пробоя уровня сопротивления можно будет прогнозировать изменение тенденции, где первая точка фиксации прибыли находится на расстоянии 23772 пунктов.
Таймфреймы М5 и М15 могут иметь больше ложных точек входа.
Shuningdek ko'ring
- Все
- Все
- Bearish Rectangle
- Bearish Symmetrical Triangle
- Bearish Symmetrical Triangle
- Bullish Rectangle
- Double Top
- Double Top
- Triple Bottom
- Triple Bottom
- Triple Top
- Triple Top
- Все
- Все
- Покупка
- Продажа
- Все
- 1
- 2
- 3
- 4
- 5
Triple Bottom
was formed on 18.04 at 16:45:15 (UTC+0)
signal strength 2 of 5
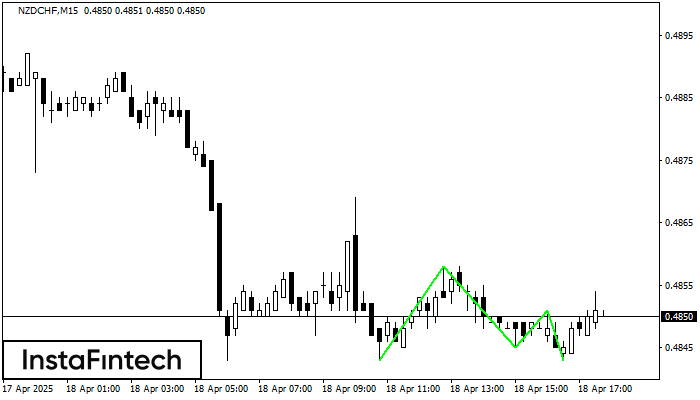
The Triple Bottom pattern has formed on the chart of the NZDCHF M15 trading instrument. The pattern signals a change in the trend from downwards to upwards in the case
The M5 and M15 time frames may have more false entry points.
Open chart in a new window
Triple Bottom
was formed on 18.04 at 16:30:12 (UTC+0)
signal strength 3 of 5
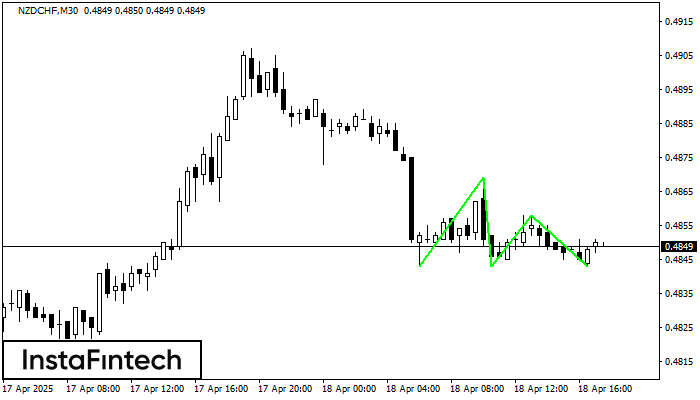
The Triple Bottom pattern has formed on the chart of the NZDCHF M30 trading instrument. The pattern signals a change in the trend from downwards to upwards in the case
Open chart in a new window
Double Top
was formed on 18.04 at 16:25:42 (UTC+0)
signal strength 1 of 5
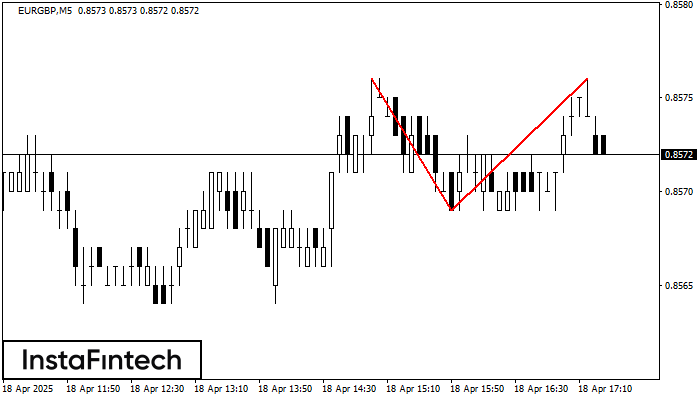
On the chart of EURGBP M5 the Double Top reversal pattern has been formed. Characteristics: the upper boundary 0.8576; the lower boundary 0.8569; the width of the pattern 7 points
The M5 and M15 time frames may have more false entry points.
Open chart in a new window