Dolzarb patternlar

Двойная вершина
сформирован 07.04 в 09:59:47 (UTC+0)
сила сигнала 3 из 5
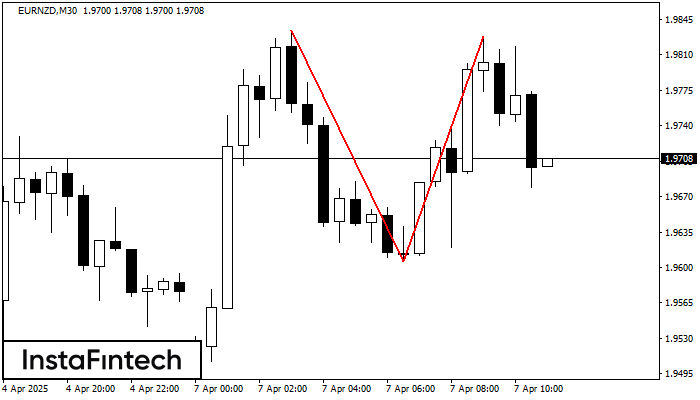
На торговом графике EURNZD M30 сформировалась разворотная фигура «Двойная вершина». Характеристика: Верхняя граница 1.9828; Нижняя граница 1.9606; Ширина фигуры 222 пунктов. Сигнал: Пробой нижней границы 1.9606 приведет к дальнейшему нисходящему движению с перспективой хода к уровню 1.9576.
- Все
- Все
- Bearish Rectangle
- Bearish Symmetrical Triangle
- Bearish Symmetrical Triangle
- Bullish Rectangle
- Double Top
- Double Top
- Triple Bottom
- Triple Bottom
- Triple Top
- Triple Top
- Все
- Все
- Покупка
- Продажа
- Все
- 1
- 2
- 3
- 4
- 5
Triple Bottom
was formed on 18.04 at 11:50:33 (UTC+0)
signal strength 1 of 5

The Triple Bottom pattern has formed on the chart of the NZDCAD M5 trading instrument. The pattern signals a change in the trend from downwards to upwards in the case
The M5 and M15 time frames may have more false entry points.
Open chart in a new window
Triple Bottom
was formed on 18.04 at 11:45:33 (UTC+0)
signal strength 2 of 5

The Triple Bottom pattern has been formed on NZDJPY M15. It has the following characteristics: resistance level 84.49/84.47; support level 84.31/84.32; the width is 18 points. In the event
The M5 and M15 time frames may have more false entry points.
Open chart in a new window
Double Top
was formed on 18.04 at 11:30:37 (UTC+0)
signal strength 2 of 5
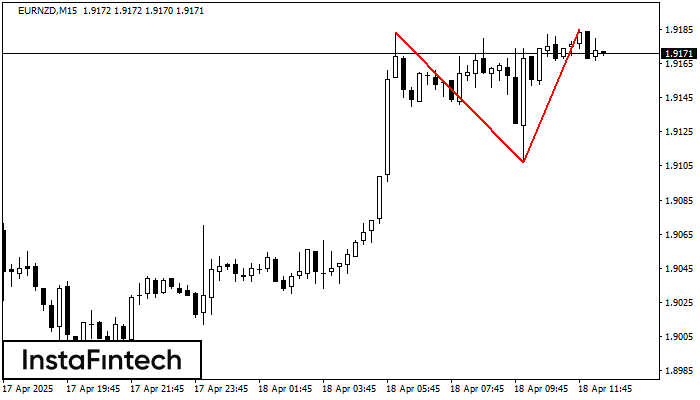
The Double Top reversal pattern has been formed on EURNZD M15. Characteristics: the upper boundary 1.9183; the lower boundary 1.9107; the width of the pattern is 78 points. Sell trades
The M5 and M15 time frames may have more false entry points.
Open chart in a new window