النماذج الفعلية

النماذج هي نماذج رسومية تتشكل في الرسم البياني حسب السعر. وفقا لأحد المسلمات التحليلية الفنية، فإن التاريخ (حركة السعر) يكرر نفسه. ويعني ذلك أن حركات الأسعار غالباً ما تكون متشابهة في نفس الأوضاع مما يجعل من الممكن التنبؤ بزيادة تطوير الوضع الذي يتسم باحتمال كبير.
النماذج ذات الصلة المقدمة من قبل إنستافوركس هي خدمة سهلة الاستخدام تسمح لك بمعرفة التغييرات الأخيرة في السوق والرد على الأدلة من السوق في الوقت المناسب. في خدمتنا، ستجد دائمًا النماذج الأكثر حداثة وملاءمة في أي زوج وأي إطار زمني.
Triple Top
was formed on 01.04 at 00:15:38 (UTC+0)
signal strength 1 of 5
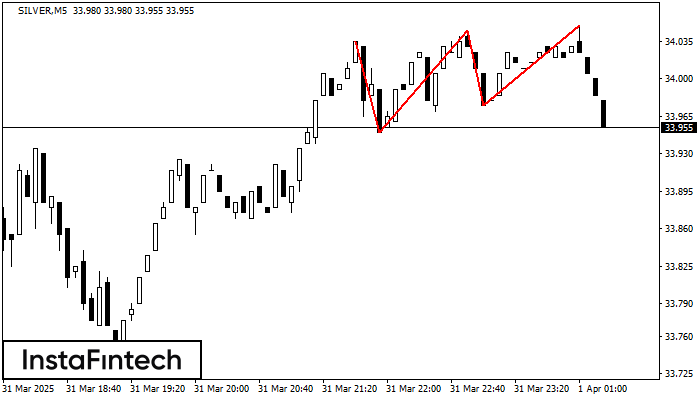
On the chart of the SILVER M5 trading instrument, the Triple Top pattern that signals a trend change has formed. It is possible that after formation of the third peak, the price will try to break through the resistance level 33.95, where we advise to open a trading position for sale. Take profit is the projection of the pattern’s width, which is 85 points.
The M5 and M15 time frames may have more false entry points.
- All
- All
- Bearish Rectangle
- Bearish Symmetrical Triangle
- Bearish Symmetrical Triangle
- Bullish Rectangle
- Double Top
- Double Top
- Triple Bottom
- Triple Bottom
- Triple Top
- Triple Top
- All
- All
- Buy
- Sale
- All
- 1
- 2
- 3
- 4
- 5
Triple Bottom
was formed on 18.04 at 20:20:31 (UTC+0)
signal strength 1 of 5

Corak Triple Bottom telah dibentuk pada GBPAUD M5. Ia mempunyai ciri-ciri berikut: tahap rintangan 2.0835/2.0826; tahap sokongan 2.0821/2.0823; lebar corak adalah 14 mata. Dalam situasi penembusan paras rintangan 2.0835, harga
Carta masa M5 dan M15 mungkin mempunyai lebih banyak titik kemasukan palsu.
Open chart in a new window
Triple Bottom
was formed on 18.04 at 20:00:39 (UTC+0)
signal strength 2 of 5

Corak Triple Bottom telah dibentuk pada carta AUDCAD M15. Ciri-ciri corak: Garisan bawah corak mempunyai koordinat 0.8845 dengan had atas 0.8845/0.8836, unjuran lebar adalah 26 mata. Pembentukan corak Triple Bottom
Carta masa M5 dan M15 mungkin mempunyai lebih banyak titik kemasukan palsu.
Open chart in a new window
Triple Bottom
was formed on 18.04 at 20:00:30 (UTC+0)
signal strength 2 of 5

Corak Triple Bottom telah dibentuk pada carta bagi instrumen dagangan NZDCHF M15. Corak menandakan perubahan aliran dari menurun ke aliran menaik dalam sekiranya penembusan 0.4858/0.4854
Carta masa M5 dan M15 mungkin mempunyai lebih banyak titik kemasukan palsu.
Open chart in a new window