Actual patterns

Patterns are graphical models which are formed in the chart by the price. According to one of the technical analysis postulates, history (price movement) repeats itself. It means that the price movements are often similar in the same situations which makes it possible to predict the further development of the situation with a high probability.
Relevant patterns by InstaTrade is an easy-to-use service which allows you to be aware of latest changes in the market and react to clues from the market in time. In our service you will always find the latest and most relevant patterns on any pair and any timeframe.
Double Bottom
was formed on 03.04 at 02:05:31 (UTC+0)
signal strength 1 of 5
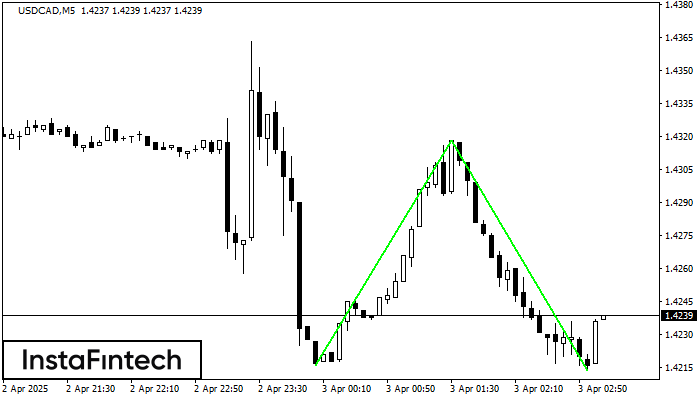
The Double Bottom pattern has been formed on USDCAD M5; the upper boundary is 1.4318; the lower boundary is 1.4214. The width of the pattern is 102 points. In case of a break of the upper boundary 1.4318, a change in the trend can be predicted where the width of the pattern will coincide with the distance to a possible take profit level.
The M5 and M15 time frames may have more false entry points.
- All
- All
- Bearish Rectangle
- Bearish Symmetrical Triangle
- Bearish Symmetrical Triangle
- Bullish Rectangle
- Double Top
- Double Top
- Triple Bottom
- Triple Bottom
- Triple Top
- Triple Top
- All
- All
- Buy
- Sale
- All
- 1
- 2
- 3
- 4
- 5
Fundo triplo
was formed on 18.04 at 20:20:31 (UTC+0)
signal strength 1 of 5

O padrão Fundo triplo foi formado em GBPAUD M5. Possui as seguintes características: nível de resistência 2.0835/2.0826; nível de suporte 2.0821/2.0823; a largura é de 14 pontos. Se houver
Os intervalos M5 e M15 podem ter mais pontos de entrada falsos.
Open chart in a new window
Fundo triplo
was formed on 18.04 at 20:00:39 (UTC+0)
signal strength 2 of 5

O padrão Fundo triplo foi formado no gráfico de AUDCAD M15. Características do padrão: A linha inferior do padrão tem coordenadas 0.8845 com o limite superior 0.8845/0.8836, a projeção
Os intervalos M5 e M15 podem ter mais pontos de entrada falsos.
Open chart in a new window
Fundo triplo
was formed on 18.04 at 20:00:30 (UTC+0)
signal strength 2 of 5

O padrão Fundo triplo foi formado no gráfico do instrumento de negociação NZDCHF M15. O padrão sinaliza uma mudança na tendência de baixa para alta no caso de quebra
Os intervalos M5 e M15 podem ter mais pontos de entrada falsos.
Open chart in a new window