Pola sebenarnya

Double Bottom
was formed on 28.03 at 22:15:04 (UTC+0)
signal strength 2 of 5
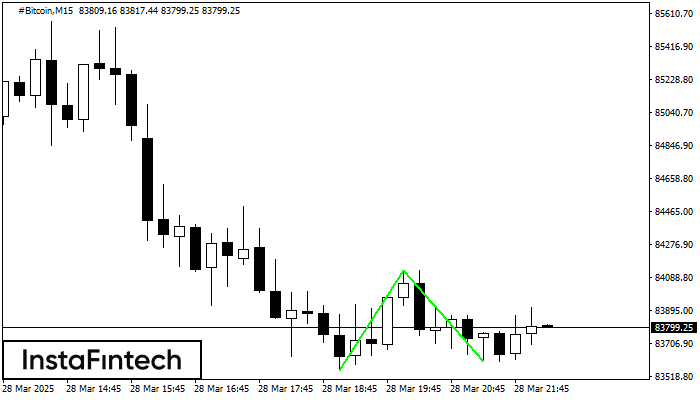
The Double Bottom pattern has been formed on #Bitcoin M15. Characteristics: the support level 83552.05; the resistance level 84127.84; the width of the pattern 57579 points. If the resistance level is broken, a change in the trend can be predicted with the first target point lying at the distance of 52661 points.
The M5 and M15 time frames may have more false entry points.
Lihat juga
- All
- All
- Bearish Rectangle
- Bearish Symmetrical Triangle
- Bearish Symmetrical Triangle
- Bullish Rectangle
- Double Top
- Double Top
- Triple Bottom
- Triple Bottom
- Triple Top
- Triple Top
- All
- All
- Buy
- Sale
- All
- 1
- 2
- 3
- 4
- 5
Panji Bearish
was formed on 07.04 at 16:10:00 (UTC+0)
signal strength 1 of 5
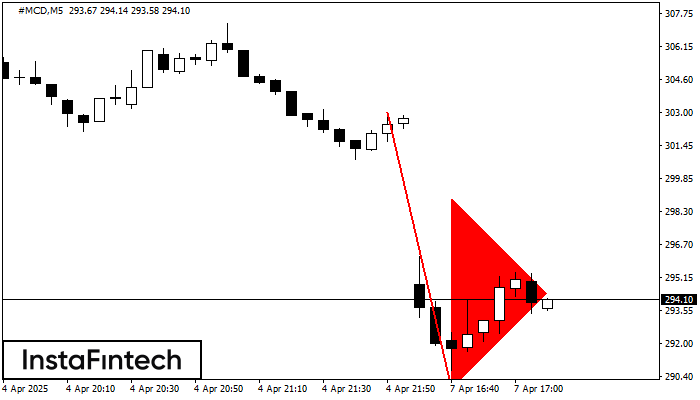
Pola Panji Bearish telah terbentuk di grafik #MCD M5. Jenis pola ini memiliki ciri sedikit perlambatan yang setelahnya harga akan bergerak ke arah tren sebenarnya. Jika harga ditetapkan di bawah
Rangka waktu M5 dan M15 mungkin memiliki lebih dari titik entri yang keliru.
Open chart in a new window
Kepala dan bahu
was formed on 07.04 at 16:09:55 (UTC+0)
signal strength 1 of 5

Menurut grafik M5, AUDCAD membentuk pola Kepala dan bahu. Puncak The Head ditetapkan di 0.8678 sementara garis median the Neck ditemukan di 0.8595/0.8604. Formasi pola Kepala dan bahu terbukti mensinyalkan
Rangka waktu M5 dan M15 mungkin memiliki lebih dari titik entri yang keliru.
Open chart in a new window
Panji Bearish
was formed on 07.04 at 16:04:58 (UTC+0)
signal strength 1 of 5
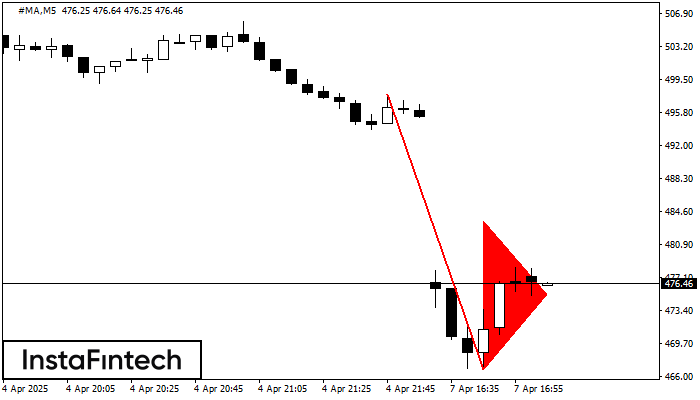
Pola Panji Bearish telah terbentuk di grafik #MA M5. Pola ini memberikan sinyal potensi kelanjutan tren yang ada. Spesifikasi: titik terendah pola berkoordinat di 466.76; proyeksi titik tertinggi sama dengan
Rangka waktu M5 dan M15 mungkin memiliki lebih dari titik entri yang keliru.
Open chart in a new window