Corak sebenar

Triple Top
was formed on 07.04 at 12:10:10 (UTC+0)
signal strength 1 of 5
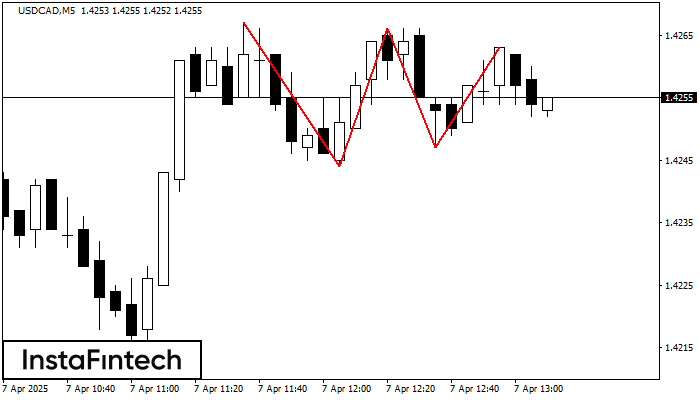
On the chart of the USDCAD M5 trading instrument, the Triple Top pattern that signals a trend change has formed. It is possible that after formation of the third peak, the price will try to break through the resistance level 1.4244, where we advise to open a trading position for sale. Take profit is the projection of the pattern’s width, which is 23 points.
The M5 and M15 time frames may have more false entry points.
- All
- All
- Bearish Rectangle
- Bearish Symmetrical Triangle
- Bearish Symmetrical Triangle
- Bullish Rectangle
- Double Top
- Double Top
- Triple Bottom
- Triple Bottom
- Triple Top
- Triple Top
- All
- All
- Buy
- Sale
- All
- 1
- 2
- 3
- 4
- 5
Fundo triplo
was formed on 18.04 at 20:20:31 (UTC+0)
signal strength 1 of 5

O padrão Fundo triplo foi formado em GBPAUD M5. Possui as seguintes características: nível de resistência 2.0835/2.0826; nível de suporte 2.0821/2.0823; a largura é de 14 pontos. Se houver
Os intervalos M5 e M15 podem ter mais pontos de entrada falsos.
Open chart in a new window
Fundo triplo
was formed on 18.04 at 20:00:39 (UTC+0)
signal strength 2 of 5

O padrão Fundo triplo foi formado no gráfico de AUDCAD M15. Características do padrão: A linha inferior do padrão tem coordenadas 0.8845 com o limite superior 0.8845/0.8836, a projeção
Os intervalos M5 e M15 podem ter mais pontos de entrada falsos.
Open chart in a new window
Fundo triplo
was formed on 18.04 at 20:00:30 (UTC+0)
signal strength 2 of 5

O padrão Fundo triplo foi formado no gráfico do instrumento de negociação NZDCHF M15. O padrão sinaliza uma mudança na tendência de baixa para alta no caso de quebra
Os intervalos M5 e M15 podem ter mais pontos de entrada falsos.
Open chart in a new window